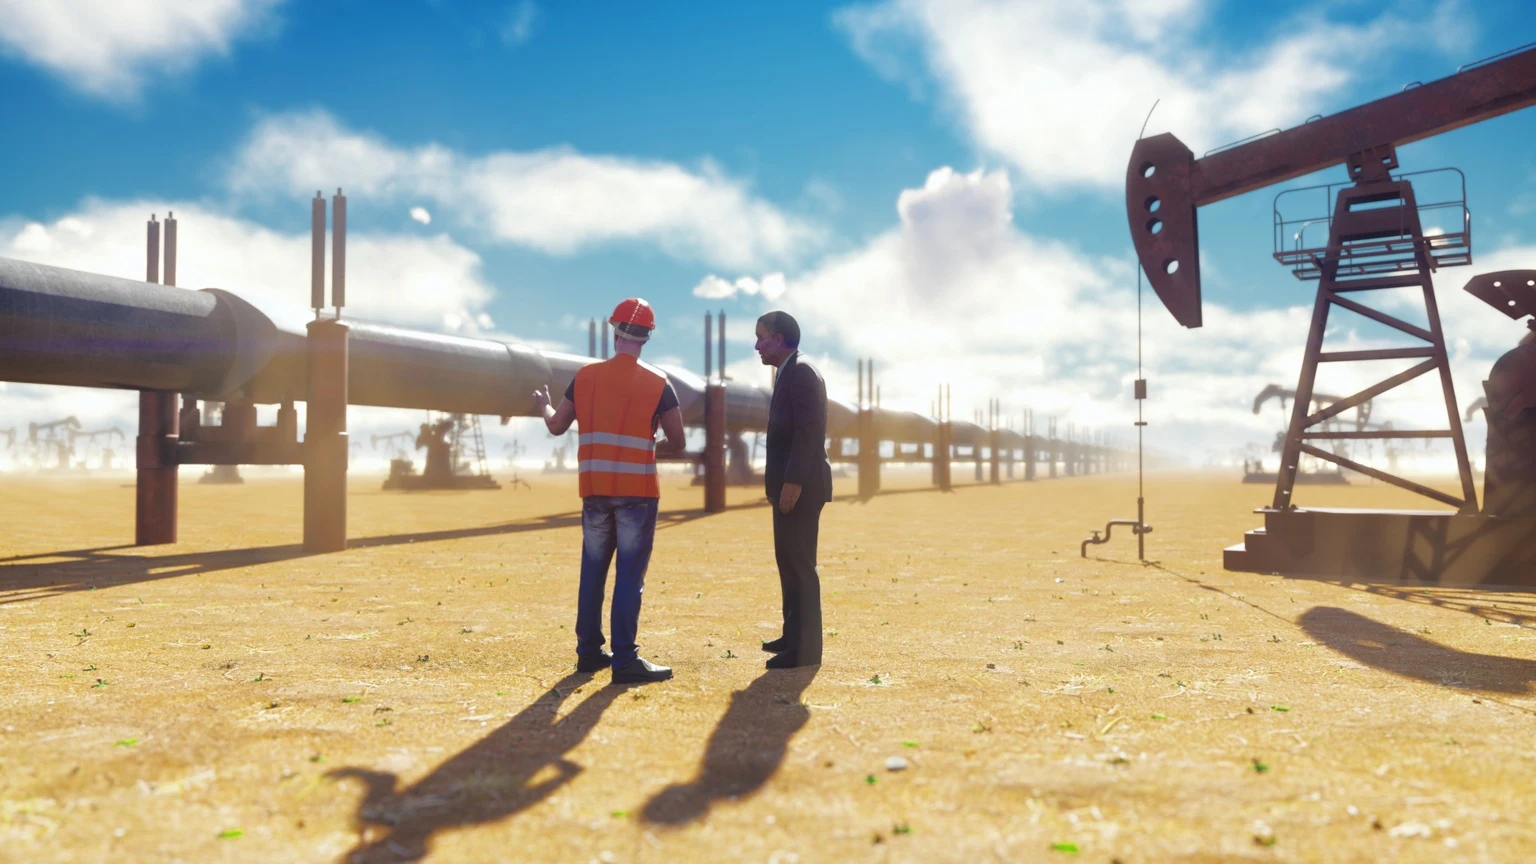
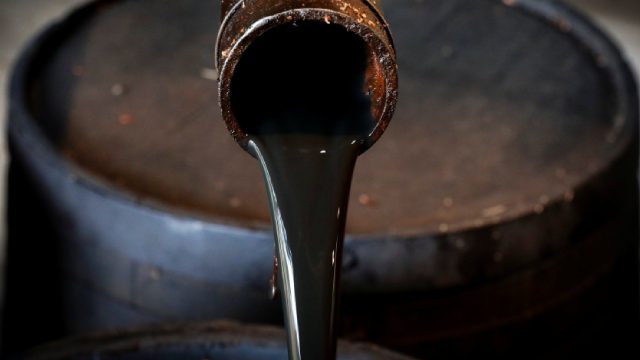
New

Chrome Plugin Live! Redefine the way you read FinTwit 🚀 Install Now

You have successfully sign out
Loading...
Shape
Western Midstream Partners, LP
WES
Shape
US Flag

NYSE

16B

Oil & Gas Midstream

Next Earning date - 26 Feb 2025

16B

Oil & Gas Midstream

Next Earning date - 26 Feb 2025

41.16USD

Shape0.36 ( 0.88%)
sun-fogPre-market 41.16$arrow-right-up0.00 (0.00%)
Market Closed (as of Feb 05, 17:55 EDT)
favorite-chart

Relative Strenght

86
favorite-chart

Volume Buzz

-60%
favorite-chart

Earning Acce

No
favorite-chart

Dist 52w H.

5%

Quote Panel

Shape
Updated February 6, 2025
1W % 1M % 3M % 1Y %

Key Metrics

Shape
  • Market Cap


  • Shares Outstanding


  • Share in Float


  • Dividende


  • Earning Date

    No Data


  • Price Target


  • Average Volume


  • Beta


  • Range


  • Industry


  • Website


  • Sector


Fundamentals

Shape

Relative Strength

Shape

WES

Sector

loading...

Top 5 RS in Group

Symbol

Company

RS

5-Day Perf.

Forecast

Shape

Analyst rating

Last analyst upgrade/downgrade

Earnings GrowthShape

status-upYoY

Current

Estimates

Q4.22

arrow
arrow

+47%

0.85
vs 0.58

Q1.23

arrow
arrow

-31%

0.52
vs 0.75

Q2.23

arrow
arrow

-14%

0.64
vs 0.74

Q3.23

arrow
arrow

+6%

0.7
vs 0.66

Q4.23

arrow
arrow

-13%

0.74
vs 0.85

Q1.24

arrow
arrow

+183%

1.47
vs 0.52

Q2.24

arrow
arrow

+52%

0.97
vs 0.64

Q3.24

arrow
arrow

+6%

0.74
vs 0.7

Q4.24

arrow
arrow

+15%

0.85
vs 0.74

Q1.25

arrow
arrow

-42%

0.86
vs 1.47

Sales GrowthShape

status-upYoY

Current

Estimates

Q4.22

arrow
arrow

+8%

779.4M  vs 719.2M

Q1.23

arrow
arrow

-3%

734M  vs 758.3M

Q2.23

arrow
arrow

-16%

738.3M  vs 876.4M

Q3.23

arrow
arrow

-7%

776M  vs 837.6M

Q4.23

arrow
arrow

+10%

858.2M  vs 779.4M

Q1.24

arrow
arrow

+21%

887.7M  vs 734M

Q2.24

arrow
arrow

+23%

905.6M  vs 738.3M

Q3.24

arrow
arrow

+14%

883.4M  vs 776M

Q4.24

arrow
arrow

+8%

927.2M  vs 858.2M

Q1.25

arrow
arrow

+5%

935.3M  vs 887.7M

Return on EquityShape

status-upQoQ

Q4.22

arrow
arrow

+11%

0.11
vs 0.09

Q1.23

arrow
arrow

+7%

0.07
vs 0.11

Q2.23

arrow
arrow

+8%

0.08
vs 0.07

Q3.23

arrow
arrow

+9%

0.09
vs 0.08

Q4.23

arrow
arrow

+10%

0.1
vs 0.09

Q1.24

arrow
arrow

+18%

0.18
vs 0.1

Q2.24

arrow
arrow

+12%

0.12
vs 0.18

Q3.24

arrow
arrow

+9%

0.09
vs 0.12

Institutionnal OwnershipShape

status-upQoQ

Q4.22

arrow
arrow

207

207
vs 200

4%

Q1.23

arrow
arrow

204

204
vs 207

-1%

Q2.23

arrow
arrow

194

194
vs 204

-5%

Q3.23

arrow
arrow

201

201
vs 194

4%

Q4.23

arrow
arrow

204

204
vs 201

1%

Q1.24

arrow
arrow

225

225
vs 204

10%

Q2.24

arrow
arrow

260

260
vs 225

16%

Q3.24

arrow
arrow

277

277
vs 260

7%

Earnings Growth

Latest News