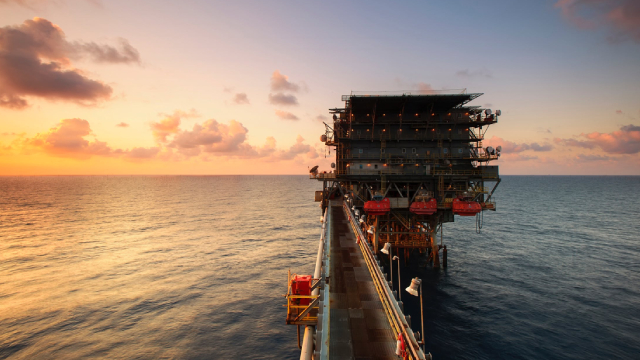
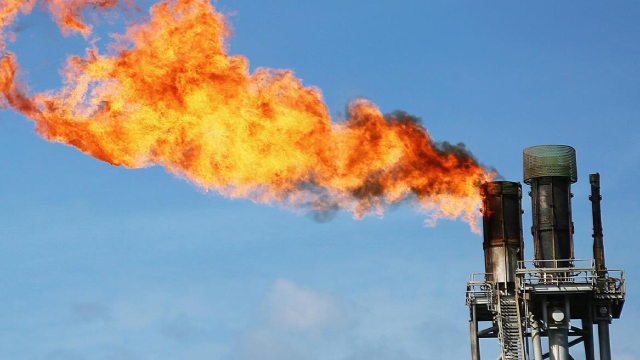
Plains All American Pipeline, L.P., through its subsidiaries, engages in the pipeline transportation, terminalling, storage, and gathering of crude oil and natural gas liquids (NGL) in the United States and Canada. The company operates in two segments, Crude Oil and NGL. The Crude Oil segment offers gathering and transporting crude oil through pipelines, gathering systems, trucks, and at times on barges or railcars. This segment provides terminalling, storage, and other facilities-related services, as well as merchant activities. As of December 31, 2021, this segment owned and leased 18,300 miles of active crude oil transportation pipelines and gathering systems, as well as an additional 110 miles of pipelines that supports crude oil storage and terminalling facilities; 74 million barrels of commercial crude oil storage capacity; 38 million barrels of active, above-ground tank capacity; four marine facilities; a condensate processing facility; seven crude oil rail terminals and 2,100 crude oil railcars; and 640 trucks and 1,275 trailers. The Natural Gas Liquids segment engages in the natural gas processing, NGL fractionation, storage, transportation, and terminalling activities. As of December 31, 2021, this segment owned and operated four natural gas processing plants; nine fractionation plants; 28 million barrels of NGL storage capacity; approximately 1,620 miles of active NGL transportation pipelines, as well as an additional 55 miles of pipeline that supports NGL storage facilities; 16 NGL rail terminals and approximately 3,900 NGL rail cars; and approximately 220 trailers. The company was founded in 1981 and is headquartered in Houston, Texas. Plains All American Pipeline, L.P. operates as a subsidiary of Plains GP Holdings, L.P.