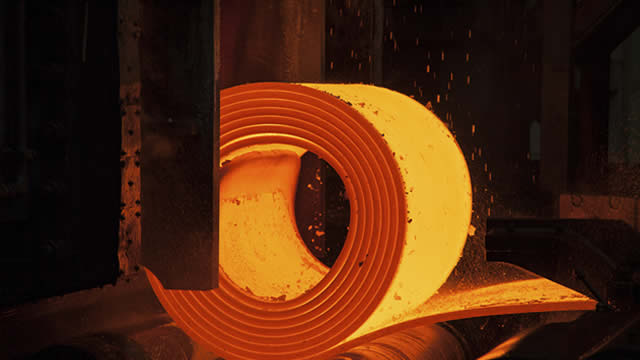
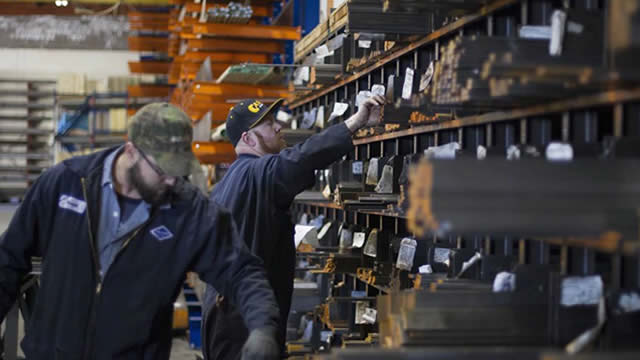
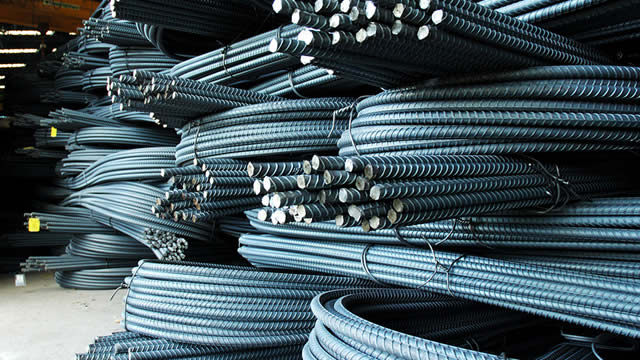
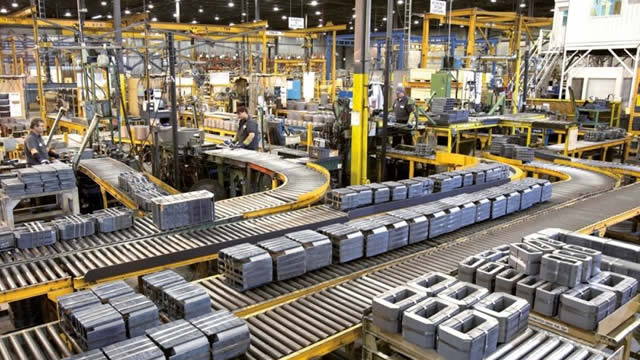
Valmont Industries, Inc. produces and sells fabricated metal products in the United States, Australia, Brazil, Denmark, and internationally. It operates through two segments: Infrastructure and Agriculture. The company manufactures and distributes engineered metal, steel, wood, aluminum, and composite poles, towers, and components for lighting, traffic, and wireless communication markets; engineered access systems; integrated structure solutions for smart cities; and highway safety products. It also offers engineered steel and concrete pole structures for utility transmission, distribution, substations, and renewable energy generation equipment; and inspection services. In addition, the company provides hot-dipped galvanizing, anodizing, and powder coating services to preserve and protect metal products; and water management solutions and technology for precision agriculture. Further, it manufactures and distributes mechanical irrigation equipment, and related parts and services under the Valley brand name for the agricultural industry; and tubular products for industrial customers. The company serves municipalities and government entities, commercial lighting fixtures manufacturing companies, contractors, telecommunications and utility companies, and large farms, as well as the general manufacturing sector. Valmont Industries, Inc. was founded in 1946 and is headquartered in Omaha, Nebraska.