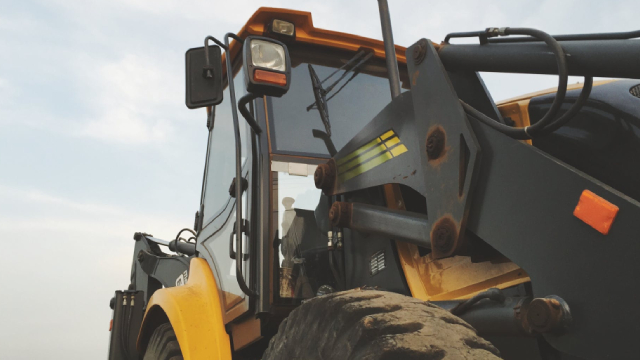
Lindsay Corporation, together with its subsidiaries, provides water management and road infrastructure products and services in the United States and internationally. The company operates in two segments, Irrigation and Infrastructure. The Irrigation segment manufactures and markets center pivot, lateral move irrigation systems, and irrigation controls under the Zimmatic brand; hose reel travelers under the Perrot and Greenfield brands; and chemical injection systems, variable rate irrigation systems, flow meters, weather stations, soil moisture sensors, and remote monitoring and control systems under the GrowSmart brand. It also offers repair and replacement parts for its irrigation systems and controls; global positioning system positioning and guidance, variable rate irrigation, wireless irrigation management, irrigation scheduling, and smartphone applications; and industrial Internet of Things technology solutions, data acquisition and management systems, and custom electronic equipment for applications under the Elecsys brand. The Infrastructure segment provides Quickchange moveable barrier systems that help in highway reconstruction, paving and resurfacing, road widening, median and shoulder construction, and tunnels and bridge repairs; and re-directive and non-re-directive crash cushions, which are used to enhance highway safety at locations, such as toll booths, freeway off-ramps, medians and roadside barrier ends, bridge supports, utility poles, and other fixed roadway hazards. It also offers specialty barrier products; road marking and road safety equipment; and railroad signals and structures, and diameter steel tubing products, as well as outsourced manufacturing and production services for other companies. The company serves departments of transportation, municipal transportation road agencies, roadway contractors, subcontractors, distributors, and dealers. Lindsay Corporation was founded in 1954 and is headquartered in Omaha, Nebraska.