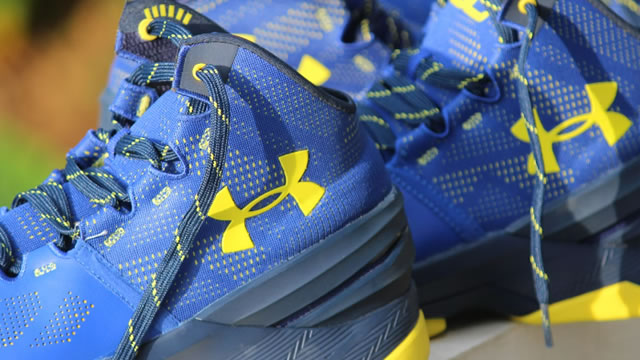
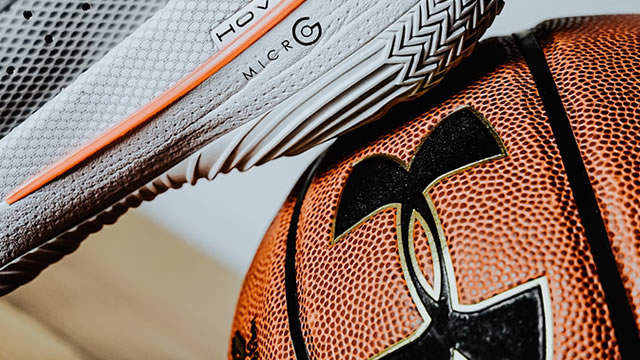
Under Armour, Inc., together with its subsidiaries, engages in the developing, marketing, and distributing performance apparel, footwear, and accessories for men, women, and youth. The company offers its apparel in compression, fitted, and loose fit types. It also provides footwear products for running, training, basketball, cleated sports, recovery, and outdoor applications. In addition, the company offers accessories, which include gloves, bags, headwear, and sports masks; and digital subscription and advertising services under the MapMyRun and MapMyRide platforms. It primarily offers its products under the UNDER ARMOUR, UA, HEATGEAR, COLDGEAR, HOVR, PROTECT THIS HOUSE, I WILL, UA Logo, ARMOUR FLEECE, and ARMOUR BRA brands. The company sells its products through wholesale channels, including national and regional sporting goods chains, independent and specialty retailers, department store chains, mono-branded Under Armour retail stores, institutional athletic departments, and leagues and teams, as well as independent distributors; and directly to consumers through a network of 422 brand and factory house stores, as well as through e-commerce websites. It operates in the United States, Canada, Europe, the Middle East, Africa, the Asia-Pacific, and Latin America. Under Armour, Inc. was incorporated in 1996 and is headquartered in Baltimore, Maryland.