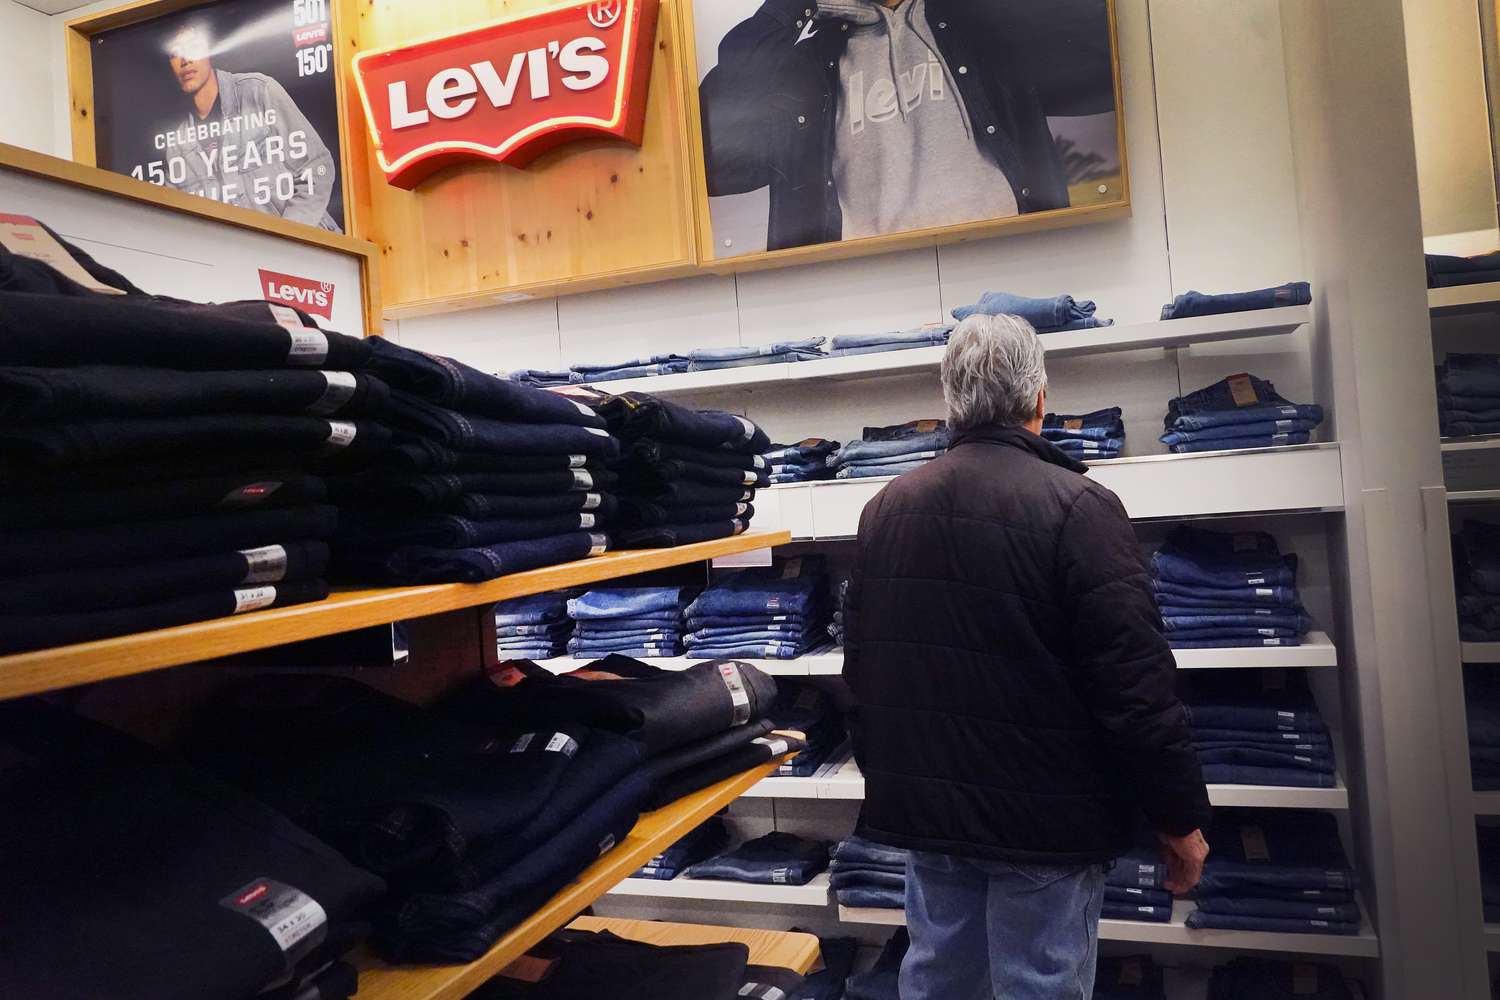
New

Chrome Plugin Live! Redefine the way you read FinTwit 🚀 Install Now

You have successfully sign out
Loading...
Shape
Levi Strauss & Co.
LEVI
Shape
US Flag

NYSE

7B

Apparel - Manufacturers

Next Earning date - 02 Apr 2025

7B

Apparel - Manufacturers

Next Earning date - 02 Apr 2025

18.47USD

Shape-0.59 ( -3.10%)
Market Closed (as of Feb 08, 00:45 EDT)
favorite-chart

Relative Strenght

63
favorite-chart

Volume Buzz

10%
favorite-chart

Earning Acce

Yes
favorite-chart

Dist 52w H.

24%

Quote Panel

Shape
Updated February 11, 2025
1W -5.11 % 1M 4.54 % 3M 8.01 % 1Y 3.47 %

Key Metrics

Shape
  • Market Cap

    7.21B


  • Shares Outstanding

    395.88M


  • Share in Float

    358.19M


  • Dividende

    0.38


  • Earning Date

    02 Apr 2025


  • Price Target

    18.21


  • Average Volume

    1.91M


  • Beta

    1.173


  • Range

    15.62-24.34


  • Industry

    Apparel - Manufacturers


  • Website

    https://www.levistrauss.com


  • Sector

    Consumer Cyclical


Fundamentals

Shape

Relative Strength

Shape

LEVI

Sector

loading...

Top 5 RS in Group

Symbol

Company

RS

5-Day Perf.

Forecast

Shape

$6B

Shape242%

2025-Revenue

$1.25

Shape172%

2025-EPS

$503M

Shape137%

2025-EBITDA

Analyst rating

Strong Sell

Sell

Buy

Neutral

Strong Buy

Shape

Hold

Price Target

0.00(-100.00%)

Number of analyst

0

Last analyst upgrade/downgrade

OTR Global

initialise

Previous: Not converted

2024-06-14

Now: Positive

Citigroup

downgrade

Previous: Not converted

2023-01-11

Now: Neutral

Goldman Sachs

downgrade

Previous: Not converted

2022-12-12

Now: Neutral

Morgan Stanley

downgrade

Previous: Not converted

2022-08-04

Now: Negative

Earnings GrowthShape

status-upYoY

Current

Estimates

Q1.23

arrow
arrow

-26%

0.34
vs 0.46

Q2.23

arrow
arrow

-86%

0.04
vs 0.29

Q3.23

arrow
arrow

-30%

0.28
vs 0.4

Q4.23

arrow
arrow

+29%

0.44
vs 0.34

Q1.24

arrow
arrow

-24%

0.26
vs 0.34

Q2.24

arrow
arrow

+300%

0.16
vs 0.04

Q3.24

arrow
arrow

+18%

0.33
vs 0.28

Q4.24

arrow
arrow

+14%

0.5
vs 0.44

Q1.25

arrow
arrow

+8%

0.28
vs 0.26

Q2.25

arrow
arrow

+10%

0.18
vs 0.16

Sales GrowthShape

status-upYoY

Current

Estimates

Q1.23

arrow
arrow

+6%

1.7B  vs 1.6B

Q2.23

arrow
arrow

-9%

1.3B  vs 1.5B

Q3.23

arrow
arrow

0%

1.5B  vs 1.5B

Q4.23

arrow
arrow

+3%

1.6B  vs 1.6B

Q1.24

arrow
arrow

-8%

1.6B  vs 1.7B

Q2.24

arrow
arrow

+8%

1.4B  vs 1.3B

Q3.24

arrow
arrow

+0%

1.5B  vs 1.5B

Q4.24

arrow
arrow

+12%

1.8B  vs 1.6B

Q1.25

arrow
arrow

-1%

1.5B  vs 1.6B

Q2.25

arrow
arrow

-1%

1.4B  vs 1.4B

Return on EquityShape

status-upQoQ

Q1.23

arrow
arrow

+6%

0.06
vs 0.08

Q2.23

arrow
arrow

0%

-0.00
vs 0.06

Q3.23

arrow
arrow

+0%

0
vs -0.00

Q4.23

arrow
arrow

+6%

0.06
vs 0

Q1.24

arrow
arrow

-1%

-0.01
vs 0.06

Q2.24

arrow
arrow

+1%

0.01
vs -0.01

Q3.24

arrow
arrow

+1%

0.01
vs 0.01

Q4.24

arrow
arrow

+9%

0.09
vs 0.01

Institutionnal OwnershipShape

status-upQoQ

Q4.22

arrow
arrow

239

239
vs 230

4%

Q1.23

arrow
arrow

216

216
vs 239

-10%

Q2.23

arrow
arrow

235

235
vs 216

9%

Q3.23

arrow
arrow

220

220
vs 235

-6%

Q4.23

arrow
arrow

221

221
vs 220

0%

Q1.24

arrow
arrow

212

212
vs 221

-4%

Q2.24

arrow
arrow

246

246
vs 212

16%

Q3.24

arrow
arrow

250

250
vs 246

2%

Earnings Growth

Latest News