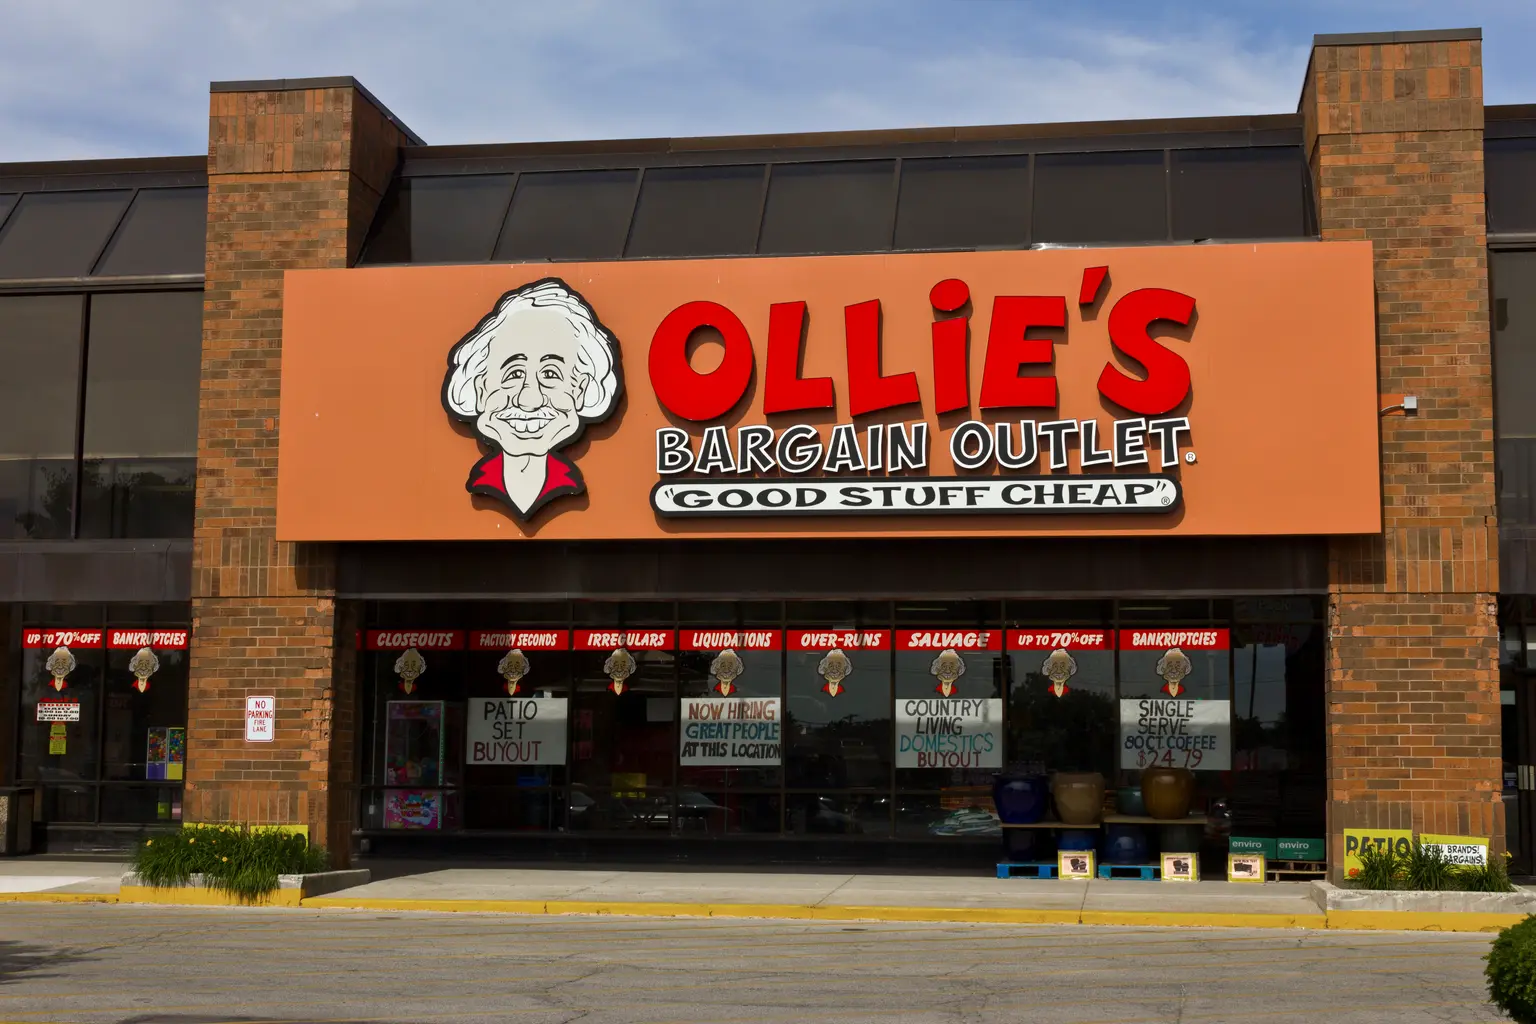
New

Chrome Plugin Live! Redefine the way you read FinTwit 🚀 Install Now

You have successfully sign out
Loading...
Shape
Ollie's Bargain Outlet Holdings, Inc.
OLLI
Shape
US Flag

NASDAQ

7B

Discount Stores

Next Earning date - 04 Jun 2025

7B

Discount Stores

Next Earning date - 04 Jun 2025

108.35USD

Shape1.64 ( 1.54%)
moonAfter-hours 104.83$arrow-left-down-0.42 (-0.40%)
Market Closed (as of Feb 14, 21:00 EDT)
favorite-chart

Relative Strenght

81
favorite-chart

Volume Buzz

-9%
favorite-chart

Earning Acce

No
favorite-chart

Dist 52w H.

10%

Quote Panel

Shape
Updated March 24, 2025
1W 9.25 % 1M 9.31 % 3M -9.67 % 1Y 36.37 %

Key Metrics

Shape
  • Market Cap

    6.63B


  • Shares Outstanding

    61.28M


  • Share in Float

    61.12M


  • Dividende

    0


  • Earning Date

    04 Jun 2025


  • Price Target

    108.22


  • Average Volume

    1.08M


  • Beta

    0.832


  • Range

    68.05-120.03


  • Industry

    Discount Stores


  • Website

    https://www.ollies.us


  • Sector

    Consumer Defensive


Fundamentals

Shape

Relative Strength

Shape

OLLI

Sector

loading...

Top 5 RS in Group

Symbol

Company

RS

5-Day Perf.

Forecast

Shape

$3B

Shape287%

2026-Revenue

$3.73

Shape233%

2026-EPS

$339M

Shape236%

2026-EBITDA

Analyst rating

Strong Sell

Sell

Buy

Neutral

Strong Buy

Shape

Buy

Price Target

133.00(22.90%)

Number of analyst

1

Last analyst upgrade/downgrade

Jefferies

downgrade

Previous: Buy

2025-02-04

Now: Hold

Citigroup

upgrade

Previous: Neutral

2024-12-18

Now: Buy

Ascendiant

upgrade

Previous: Not converted

2024-08-26

Now: Buy

Loop Capital Markets

upgrade

Previous: Equal-Weight

2024-04-05

Now: Buy

Earnings GrowthShape

status-upYoY

Current

Estimates

Q2.23

arrow
arrow

+145%

0.49
vs 0.2

Q3.23

arrow
arrow

+205%

0.67
vs 0.22

Q4.23

arrow
arrow

+38%

0.51
vs 0.37

Q1.24

arrow
arrow

+46%

1.23
vs 0.84

Q2.24

arrow
arrow

+49%

0.73
vs 0.49

Q3.24

arrow
arrow

+16%

0.78
vs 0.67

Q4.24

arrow
arrow

+14%

0.58
vs 0.51

Q1.25

arrow
arrow

-3%

1.19
vs 1.23

Q2.25

arrow
arrow

-3%

0.71
vs 0.73

Q3.25

arrow
arrow

+18%

0.92
vs 0.78

Sales GrowthShape

status-upYoY

Current

Estimates

Q2.23

arrow
arrow

+13%

459.2M  vs 406.7M

Q3.23

arrow
arrow

+14%

514.5M  vs 452.5M

Q4.23

arrow
arrow

+15%

480.1M  vs 418.1M

Q1.24

arrow
arrow

+18%

648.9M  vs 549.8M

Q2.24

arrow
arrow

+11%

508.8M  vs 459.2M

Q3.24

arrow
arrow

+12%

578.4M  vs 514.5M

Q4.24

arrow
arrow

+8%

517.4M  vs 480.1M

Q1.25

arrow
arrow

+3%

667.1M  vs 648.9M

Q2.25

arrow
arrow

+11%

565.2M  vs 508.8M

Q3.25

arrow
arrow

+13%

655.2M  vs 578.4M

Return on EquityShape

status-upQoQ

Q2.23

arrow
arrow

+2%

0.02
vs 0.04

Q3.23

arrow
arrow

+3%

0.03
vs 0.02

Q4.23

arrow
arrow

+2%

0.02
vs 0.03

Q1.24

arrow
arrow

+5%

0.05
vs 0.02

Q2.24

arrow
arrow

+3%

0.03
vs 0.05

Q3.24

arrow
arrow

+3%

0.03
vs 0.03

Q4.24

arrow
arrow

+2%

0.02
vs 0.03

Q1.25

arrow
arrow

+4%

0.04
vs 0.02

Institutionnal OwnershipShape

status-upQoQ

Q1.23

arrow
arrow

343

343
vs 334

3%

Q2.23

arrow
arrow

342

342
vs 343

0%

Q3.23

arrow
arrow

377

377
vs 342

10%

Q4.23

arrow
arrow

399

399
vs 377

6%

Q1.24

arrow
arrow

393

393
vs 399

-1%

Q2.24

arrow
arrow

436

436
vs 393

11%

Q3.24

arrow
arrow

439

439
vs 436

1%

Q4.24

arrow
arrow

497

497
vs 439

13%

Earnings Growth

Latest News