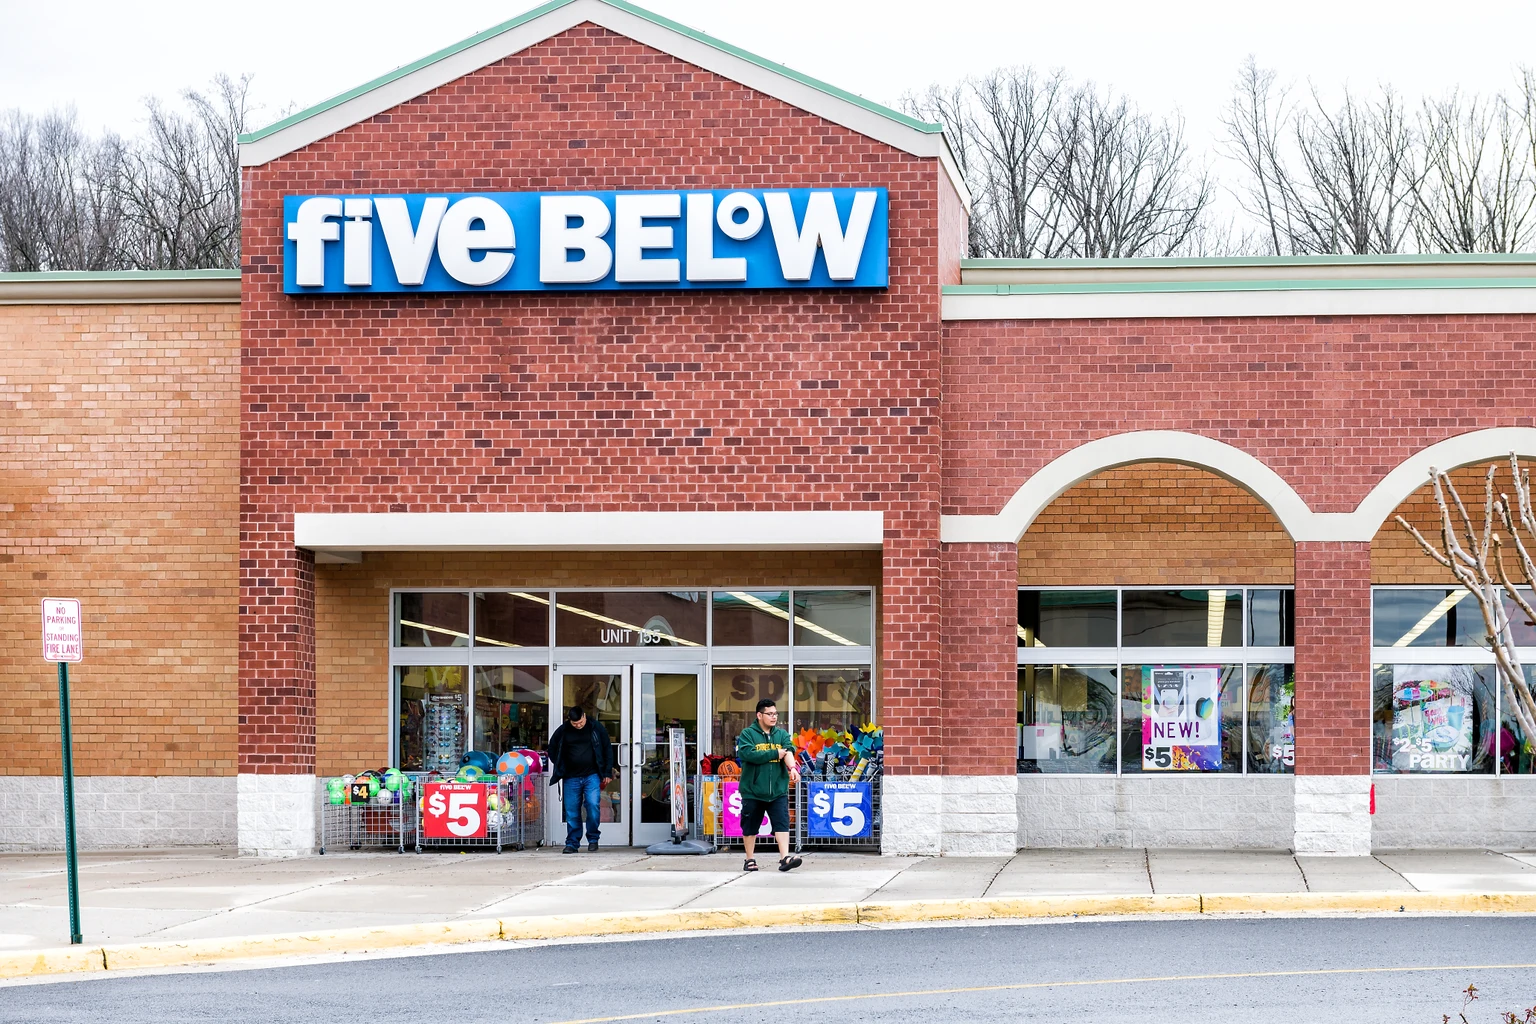
Five Below, Inc. operates as a specialty value retailer in the United States. The company offers range of accessories, which includes novelty socks, sunglasses, jewelry, scarves, gloves, hair accessories, athletic tops and bottoms, and t-shirts, as well as nail polish, lip gloss, fragrance, and branded cosmetics; and personalized living space products, such as lamps, posters, frames, fleece blankets, plush items, pillows, candles, incense, lighting, novelty décor, accent furniture, and related items, as well as provides storage options. It provides assortment of sports balls, team sports merchandise, and fitness accessories comprising hand weights, jump ropes, and gym balls; various games, such as board games, puzzles, collectibles, and toys, including remote control; and summer season sports, which includes pool, beach, and outdoor toys, as well as games and accessories. In addition, the company offers accessories for cell phones, tablets, audio, and computers, as well as cases, chargers, headphones, and other related items; and media products including books, video games, and DVDs. It also provides assortment of craft activity kits, and arts and crafts supplies, such as crayons, markers, and stickers; and school products comprising backpacks, fashion notebooks and journals, novelty pens and pencils, and locker accessories. Further, the company offers party products, which includes party goods, decorations, gag gifts, and greeting cards, as well as every day and special occasion merchandise; assortment of classic and novelty candy bars, movie-size box candy, seasonal-related candy, and gum and snack food products, as well as sells chilled drinks through coolers; and provides seasonally specific items used to celebrate and decorate for events. The company was formerly known as Cheap Holdings, Inc. and changed its name to Five Below, Inc. in August 2002. Five Below, Inc. was incorporated in 2002 and is headquartered in Philadelphia, Pennsylvania.