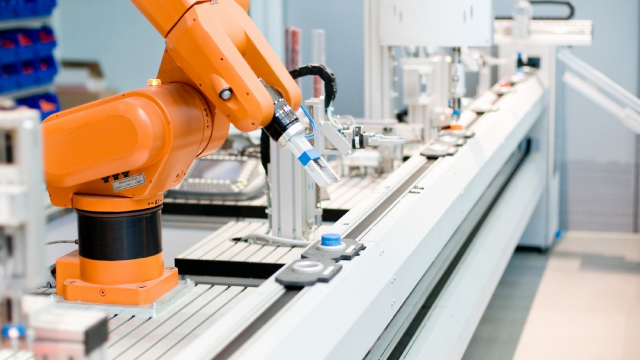
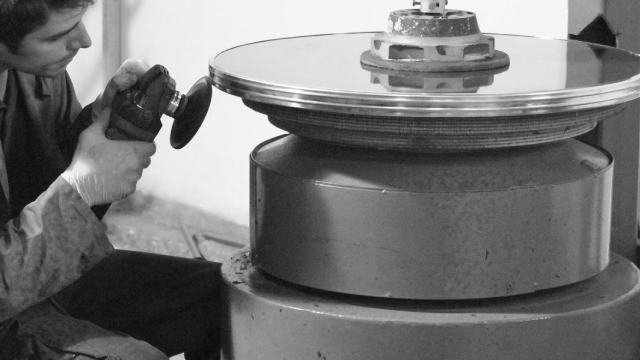
3M Company operates as a diversified technology company worldwide. It operates through four segments: Safety and Industrial; Transportation and Electronics; Health Care; and Consumer. The Safety and Industrial segment offers industrial abrasives and finishing for metalworking applications; autobody repair solutions; closure systems for personal hygiene products, masking, and packaging materials; electrical products and materials for construction and maintenance, power distribution, and electrical original equipment manufacturers; structural adhesives and tapes; respiratory, hearing, eye, and fall protection solutions; and natural and color-coated mineral granules for shingles. The Transportation and Electronics segment provides ceramic solutions; attachment tapes, films, sound, and temperature management for transportation vehicles; premium large format graphic films for advertising and fleet signage; light management films and electronics assembly solutions; packaging and interconnection solutions; and reflective signage for highway, and vehicle safety. The Healthcare segment offers food safety indicator solutions; health care procedure coding and reimbursement software; skin, wound care, and infection prevention products and solutions; dentistry and orthodontia solutions; and filtration and purification systems. The Consumer segment provides consumer bandages, braces, supports and consumer respirators; cleaning products for the home; retail abrasives, paint accessories, car care DIY products, picture hanging, and consumer air quality solutions; and stationery products. It offers its products through e-commerce and traditional wholesalers, retailers, jobbers, distributors, and dealers. The company was founded in 1902 and is based in St. Paul, Minnesota.