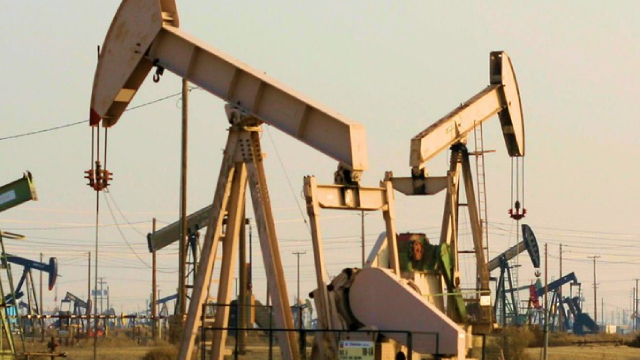
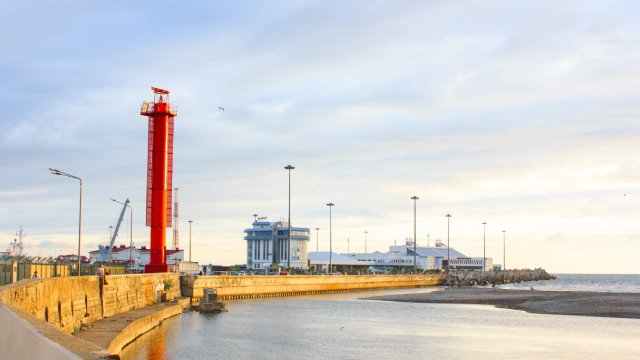
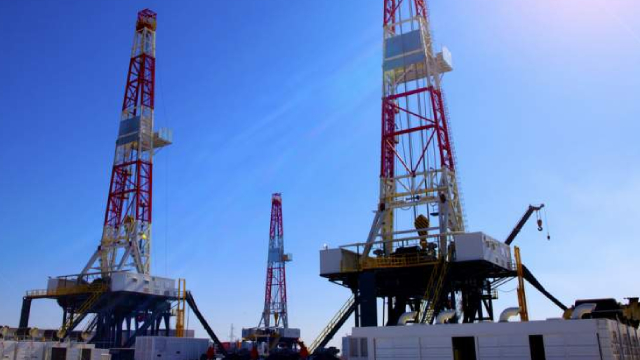
Enerflex Ltd. supplies natural gas compression, oil and gas processing, refrigeration systems, energy transition solutions, and electric power generation equipment to the oil and natural gas industry. The company provides custom and standard compression packages for reciprocating and screw compressor applications; and designs, engineers, manufactures, constructs, and installs modular natural gas processing equipment, refrigeration systems, and electric power solutions, as well as engages in re-engineering, re-configuration, and re-packaging of compressors for various field applications; and modular processing equipment and waste gas systems for natural gas facilities. It also offers after-market services, parts distribution, operations and maintenance solutions, equipment optimization and maintenance programs, manufacturer warranties, exchange components, long-term service agreements, and technical services. In addition, the company rents natural gas compressors totaling approximately 800,000 horsepower. It serves small to large independent producers, integrated oil and natural gas companies, midstream and petrochemical companies, power generation companies, users of natural gas-fired electric power, and carbon capture players in Canada, the United States, Argentina, Bolivia, Brazil, Colombia, Mexico, the United Kingdom, Bahrain Kuwait, Oman, the United Arab Emirates, Australia, New Zealand, Indonesia, Malaysia, and Thailand. Enerflex Ltd. was founded in 1980 and is headquartered in Calgary, Canada.