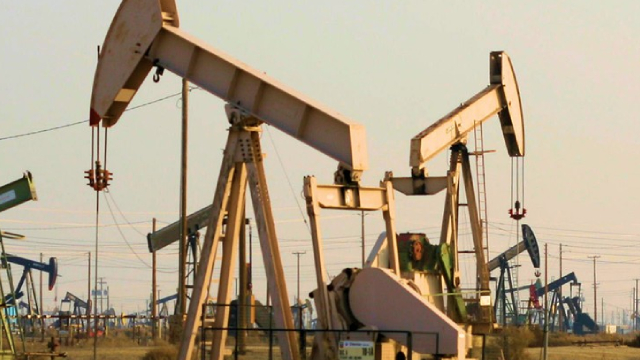
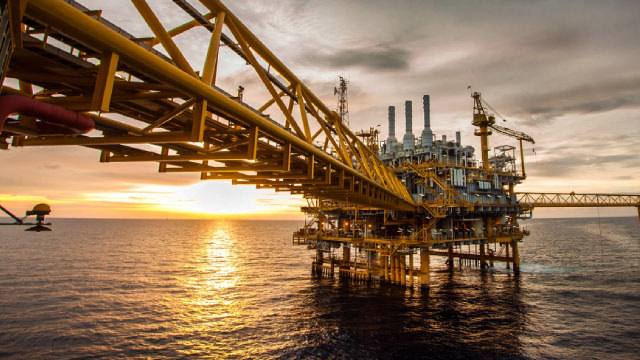
MRC Global Inc., through its subsidiaries, distributes pipes, valves, fittings, and other infrastructure products and services to the energy, industrial, and gas utility end-markets in the United States, Canada, and internationally. It offers ball, butterfly, gate, globe, check, diaphragm, needle, and plug valves; and other products, such as lined corrosion resistant piping systems, control valves, valve automation, and top work components, as well as valve modification services; and measurement, steam, and instrumentation products. The company also provides carbon steel fittings and flanges comprising carbon weld fittings, flanges, and piping components; stainless steel, alloy and corrosion resistant pipes, tubing, fittings, and flanges; and carbon line pipes. In addition, it offers natural gas distribution products, including risers, meters, polyethylene pipes and fittings, and various other components and industrial supplies; oilfield and industrial supplies and completion equipment, such as high density polyethylene pipes, fittings, and rods; and specialized production equipment comprising tanks and separators. Further, the company provides various services, such as product testing, manufacturer assessments, multiple daily deliveries, volume purchasing, inventory and zone store management and warehousing, technical support, training, just-in-time delivery, truck stocking, order consolidation, product tagging and system interfaces, and valve inspection and repair services; and various other services under the ValidTorque and FastTrack names. Its products are used in the construction, maintenance, repair, and overhaul of equipment used in extreme operating conditions, including high pressure, high/low temperature, and high corrosive and abrasive environments. The company was formerly known as McJunkin Red Man Holding Corporation and changed its name to MRC Global Inc. in January 2012. MRC Global Inc. was founded in 1921 and is headquartered in Houston, Texas.