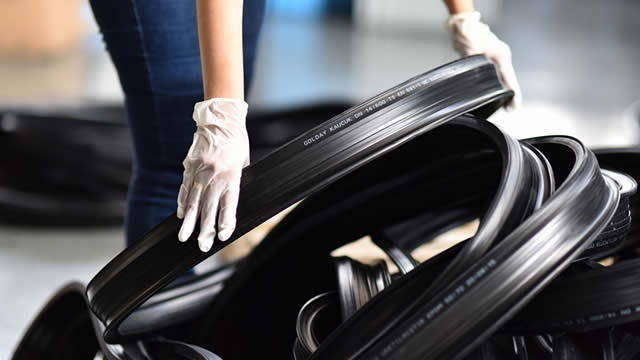
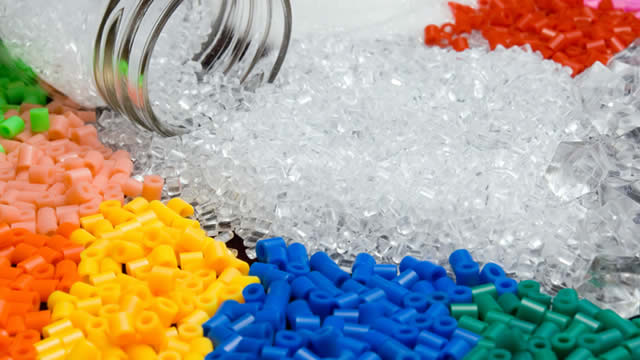
Carlisle Companies Incorporated operates as a diversified manufacturer of engineered products in the United States, Europe, Asia, Canada, Mexico, the Middle East, Africa, and internationally. It operates through three segments: Carlisle Construction Materials, Carlisle Interconnect Technologies, and Carlisle Fluid Technologies. The Carlisle Construction Materials segment produces building envelopes for commercial, industrial, and residential buildings, including single-ply roofing products, rigid foam insulations, spray polyurethane foam, architectural metal products, heating, ventilation and air conditioning hardware and sealants, waterproofing products, and air and vapor barrier systems. The Carlisle Interconnect Technologies segment produces wires and cables, including optical fiber for the commercial aerospace, military and defense electronics, medical device, industrial, and test and measurement markets. It also offers sensors, connectors, contacts, cable assemblies, complex harnesses, racks, trays, and installation kits, as well as engineering and certification services. The Carlisle Fluid Technologies segment produces engineered liquid products, powder products, sealants and adhesives finishing equipment, and integrated system solutions for spraying, pumping, mixing, metering, and curing of coatings used in the automotive manufacture, general industrial, protective coating, wood, and specialty and automotive refinishing markets. The company sells its products under the Carlisle, Binks, DeVilbiss, Ransburg, BGK, MS Powder, Thermax, Tri-Star, LHi Technology, Providien, SynTec, Weatherbond, Hunter Panels, Resitrix, Hertalan, Insulfoam, and Versico brands. Carlisle Companies Incorporated was founded in 1917 and is headquartered in Scottsdale, Arizona.