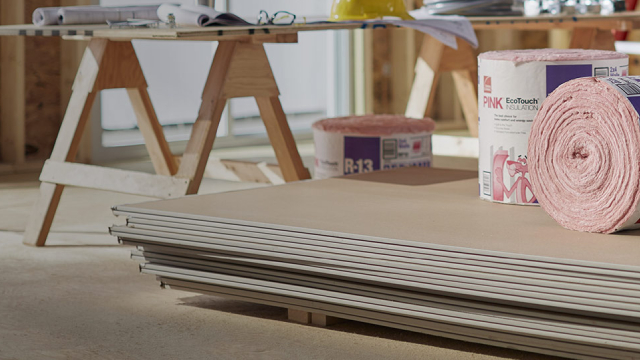
Masco Corporation designs, manufactures, and distributes home improvement and building products in North America, Europe, and internationally. The company's Plumbing Products segment offers faucets, showerheads, handheld showers, valves, bath hardware and accessories, bathing units, shower bases and enclosures, sinks, toilets, acrylic tubs, shower trays, spas, exercise pools, and fitness systems; brass, copper, and composite plumbing system components; connected water products; thermoplastic solutions, extruded plastic profiles, specialized fabrications, and PEX tubing products; and other non-decorative plumbing products. This segment provides its products under the DELTA, BRIZO, PEERLESS, HANSGROHE, AXOR, KRAUS, EASY DRAIN, STEAMIST, ELITESTEAM, GINGER, NEWPORT BRASS, BRASSTECH, WALTEC, BRISTAN, HERITAGE, MIROLIN, HOT SPRING, CALDERA, FREEFLOW SPAS, FANTASY SPAS, ENDLESS POOLS, BRASSCRAFT, PLUMB SHOP, COBRA, COBRA PRO, and MASTER PLUMBER brands. Its Decorative Architectural Products segment offers paints, primers, specialty coatings, stains, and waterproofing products, as well as paint applicators and accessories; cabinet and door hardware, functional hardware, wall plates, hook and rail products, closet organization systems, and picture hanging accessories; decorative bath hardware, mirrors, and shower accessories and doors; and decorative indoor and outdoor lighting fixtures, ceiling fans, landscape lighting, and LED lighting systems. This segment provides its products under the BEHR, KILZ, WHIZZ, Elder & Jenks, LIBERTY, BRAINERD, FRANKLIN BRASS, KICHLER, and ÉLAN brands. It sells its products to the plumbing, heating, and hardware wholesalers; home centers and online retailers; hardware stores; electrical and landscape distributors; lighting showrooms; building supply outlets; and other mass merchandisers. Masco Corporation was incorporated in 1929 and is headquartered in Livonia, Michigan.