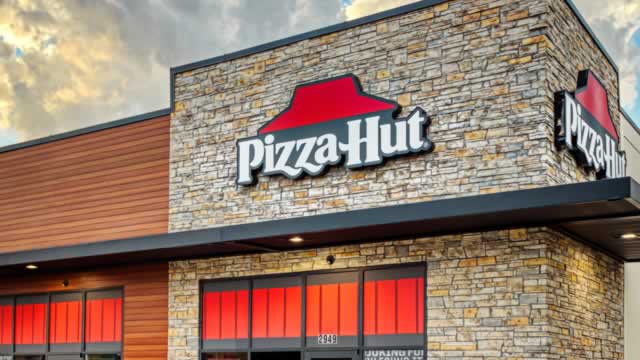
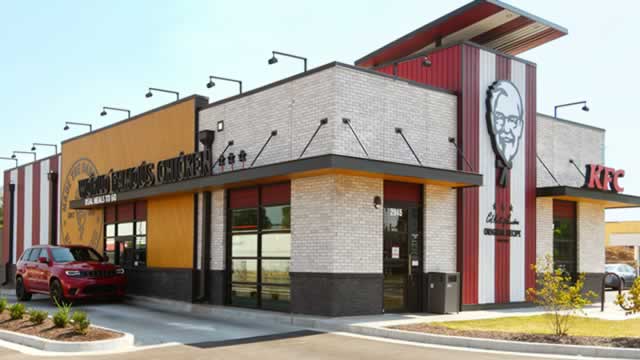
New

Chrome Plugin Live! Redefine the way you read FinTwit 🚀 Install Now

You have successfully sign out
Loading...
Shape
Yum! Brands, Inc.
YUM
Shape
US Flag

NYSE

40B

Restaurants

Next Earning date - 29 Apr 2025

40B

Restaurants

Next Earning date - 29 Apr 2025

144.50USD

Shape0.49 ( 0.34%)
Market Closed (as of Feb 08, 01:00 EDT)
favorite-chart

Relative Strenght

64
favorite-chart

Volume Buzz

29%
favorite-chart

Earning Acce

Yes
favorite-chart

Dist 52w H.

0%

Quote Panel

Shape
Updated February 9, 2025
1W 9.17 % 1M 16.48 % 3M 5.59 % 1Y 11.46 %

Key Metrics

Shape
  • Market Cap

    40.33B


  • Shares Outstanding

    279.07M


  • Share in Float

    278.21M


  • Dividende

    2.68


  • Earning Date

    29 Apr 2025


  • Price Target

    144.5


  • Average Volume

    1.83M


  • Beta

    1.095


  • Range

    122.13-144.68


  • Industry

    Restaurants


  • Website

    https://www.yum.com


  • Sector

    Consumer Cyclical


Fundamentals

Shape

Relative Strength

Shape

YUM

Sector

loading...

Top 5 RS in Group

Symbol

Company

RS

5-Day Perf.

Forecast

Shape

$8B

Shape342%

2025-Revenue

$6.00

Shape344%

2025-EPS

$3B

Shape321%

2025-EBITDA

Analyst rating

Strong Sell

Sell

Buy

Neutral

Strong Buy

Shape

Hold

Price Target

162.00(12.11%)

Number of analyst

1

Last analyst upgrade/downgrade

Citigroup

downgrade

Previous: Buy

2025-01-10

Now: Neutral

Cowen & Co.

downgrade

Previous: Buy

2024-10-16

Now: Hold

Goldman Sachs

initialise

Previous: Buy

2024-06-13

Now: Neutral

Oppenheimer

upgrade

Previous: Not converted

2024-01-05

Now: Outperform

Earnings GrowthShape

status-upYoY

Current

Estimates

Q4.22

arrow
arrow

+28%

1.31
vs 1.02

Q1.23

arrow
arrow

+1%

1.06
vs 1.05

Q2.23

arrow
arrow

+34%

1.41
vs 1.05

Q3.23

arrow
arrow

+32%

1.44
vs 1.09

Q4.23

arrow
arrow

-4%

1.26
vs 1.31

Q1.24

arrow
arrow

+8%

1.15
vs 1.06

Q2.24

arrow
arrow

-4%

1.35
vs 1.41

Q3.24

arrow
arrow

-5%

1.37
vs 1.44

Q4.24

arrow
arrow

+27%

1.6
vs 1.26

Q1.25

arrow
arrow

+11%

1.27
vs 1.15

Sales GrowthShape

status-upYoY

Current

Estimates

Q4.22

arrow
arrow

+7%

2B  vs 1.9B

Q1.23

arrow
arrow

+6%

1.6B  vs 1.5B

Q2.23

arrow
arrow

+3%

1.7B  vs 1.6B

Q3.23

arrow
arrow

+4%

1.7B  vs 1.6B

Q4.23

arrow
arrow

+1%

2B  vs 2B

Q1.24

arrow
arrow

-3%

1.6B  vs 1.6B

Q2.24

arrow
arrow

+5%

1.8B  vs 1.7B

Q3.24

arrow
arrow

+7%

1.8B  vs 1.7B

Q4.24

arrow
arrow

+16%

2.4B  vs 2B

Q1.25

arrow
arrow

+14%

1.8B  vs 1.6B

Return on EquityShape

status-upQoQ

Q4.22

arrow
arrow

-4%

-0.04
vs -0.04

Q1.23

arrow
arrow

-3%

-0.03
vs -0.04

Q2.23

arrow
arrow

-5%

-0.05
vs -0.03

Q3.23

arrow
arrow

-5%

-0.05
vs -0.05

Q4.23

arrow
arrow

-6%

-0.06
vs -0.05

Q1.24

arrow
arrow

-4%

-0.04
vs -0.06

Q2.24

arrow
arrow

-5%

-0.05
vs -0.04

Q3.24

arrow
arrow

-5%

-0.05
vs -0.05

Institutionnal OwnershipShape

status-upQoQ

Q4.22

arrow
arrow

1210

1.2K
vs 1.1K

10%

Q1.23

arrow
arrow

1219

1.2K
vs 1.2K

1%

Q2.23

arrow
arrow

1208

1.2K
vs 1.2K

-1%

Q3.23

arrow
arrow

1164

1.2K
vs 1.2K

-4%

Q4.23

arrow
arrow

1259

1.3K
vs 1.2K

8%

Q1.24

arrow
arrow

1267

1.3K
vs 1.3K

1%

Q2.24

arrow
arrow

1241

1.2K
vs 1.3K

-2%

Q3.24

arrow
arrow

1265

1.3K
vs 1.2K

2%

Earnings Growth

Latest News

YUM

seekingalpha.com

16 hours ago