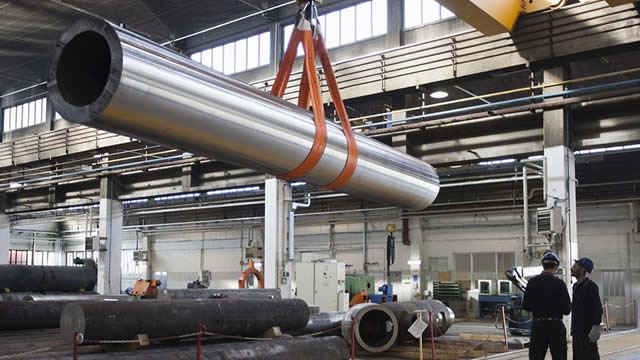
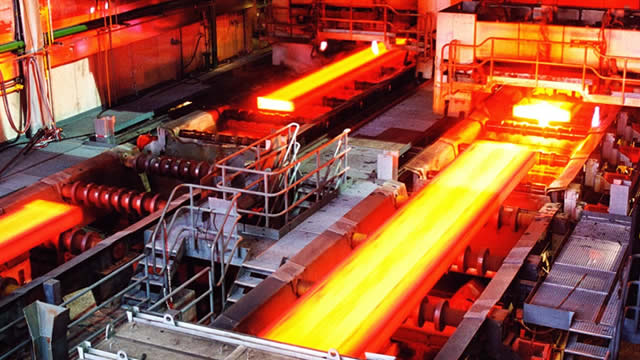
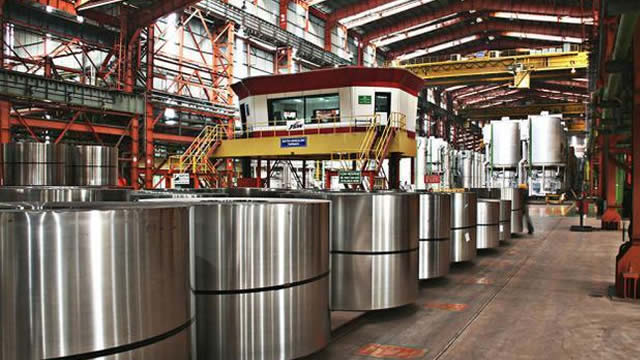
New

Chrome Plugin Live! Redefine the way you read FinTwit 🚀 Install Now

You have successfully sign out
Loading...
Shape
United States Steel Corporation
X
Shape
US Flag

NYSE

9B

Steel

Next Earning date - 01 May 2025

9B

Steel

Next Earning date - 01 May 2025

38.27USD

Shape-0.16 ( -0.42%)
Market Closed (as of Feb 18, 21:00 EDT)
favorite-chart

Relative Strenght

92
favorite-chart

Volume Buzz

-47%
favorite-chart

Earning Acce

No
favorite-chart

Dist 52w H.

12%

Quote Panel

Shape
Updated March 23, 2025
1W 1.97 % 1M 8.52 % 3M 28.09 % 1Y 2.12 %

Key Metrics

Shape
  • Market Cap

    9.21B


  • Shares Outstanding

    225.22M


  • Share in Float

    221.45M


  • Dividende

    0.2


  • Earning Date

    01 May 2025


  • Price Target

    40.9


  • Average Volume

    6.92M


  • Beta

    1.864


  • Range

    26.92-43.35


  • Industry

    Steel


  • Website

    https://www.ussteel.com


  • Sector

    Basic Materials


Fundamentals

Shape

Relative Strength

Shape

X

Sector

loading...

Top 5 RS in Group

Symbol

Company

RS

5-Day Perf.

Forecast

Shape

$17B

Shape372%

2025-Revenue

$2.22

Shape656%

2025-EPS

$2B

Shape1320%

2025-EBITDA

Analyst rating

Strong Sell

Sell

Buy

Neutral

Strong Buy

Shape

Buy

Price Target

41.00(0.24%)

Number of analyst

2

Last analyst upgrade/downgrade

GLJ Research

upgrade

Previous: Not converted

2024-09-09

Now: Buy

Exane BNP Paribas

upgrade

Previous: Not converted

2024-09-06

Now: Outperform

BMO Capital

upgrade

Previous: Market Perform

2024-06-25

Now: Outperform

Jefferies

initialise

Previous: Not converted

2024-05-20

Now: Buy

Earnings GrowthShape

status-upYoY

Current

Estimates

Q1.23

arrow
arrow

-75%

0.77
vs 3.05

Q2.23

arrow
arrow

-50%

1.92
vs 3.86

Q3.23

arrow
arrow

-28%

1.4
vs 1.95

Q4.23

arrow
arrow

-23%

0.67
vs 0.87

Q1.24

arrow
arrow

+6%

0.82
vs 0.77

Q2.24

arrow
arrow

-56%

0.84
vs 1.92

Q3.24

arrow
arrow

-60%

0.56
vs 1.4

Q4.24

arrow
arrow

N/A

-0.13
vs 0.67

Q1.25

arrow
arrow

N/A

-0.40
vs 0.82

Q2.25

arrow
arrow

-17%

0.7
vs 0.84

Sales GrowthShape

status-upYoY

Current

Estimates

Q1.23

arrow
arrow

-15%

4.5B  vs 5.2B

Q2.23

arrow
arrow

-20%

5B  vs 6.3B

Q3.23

arrow
arrow

-15%

4.4B  vs 5.2B

Q4.23

arrow
arrow

-4%

4.1B  vs 4.3B

Q1.24

arrow
arrow

-6%

4.2B  vs 4.5B

Q2.24

arrow
arrow

-18%

4.1B  vs 5B

Q3.24

arrow
arrow

-13%

3.8B  vs 4.4B

Q4.24

arrow
arrow

-15%

3.5B  vs 4.1B

Q1.25

arrow
arrow

-14%

3.6B  vs 4.2B

Q2.25

arrow
arrow

+1%

4.1B  vs 4.1B

Return on EquityShape

status-upQoQ

Q1.23

arrow
arrow

+2%

0.02
vs 0.02

Q2.23

arrow
arrow

+4%

0.04
vs 0.02

Q3.23

arrow
arrow

+3%

0.03
vs 0.04

Q4.23

arrow
arrow

-1%

-0.01
vs 0.03

Q1.24

arrow
arrow

+2%

0.02
vs -0.01

Q2.24

arrow
arrow

+2%

0.02
vs 0.02

Q3.24

arrow
arrow

+1%

0.01
vs 0.02

Q4.24

arrow
arrow

-1%

-0.01
vs 0.01

Institutionnal OwnershipShape

status-upQoQ

Q1.23

arrow
arrow

491

491
vs 485

1%

Q2.23

arrow
arrow

473

473
vs 491

-4%

Q3.23

arrow
arrow

539

539
vs 473

14%

Q4.23

arrow
arrow

610

610
vs 539

13%

Q1.24

arrow
arrow

584

584
vs 610

-4%

Q2.24

arrow
arrow

554

554
vs 584

-5%

Q3.24

arrow
arrow

575

575
vs 554

4%

Q4.24

arrow
arrow

627

627
vs 575

9%

Earnings Growth

Latest News