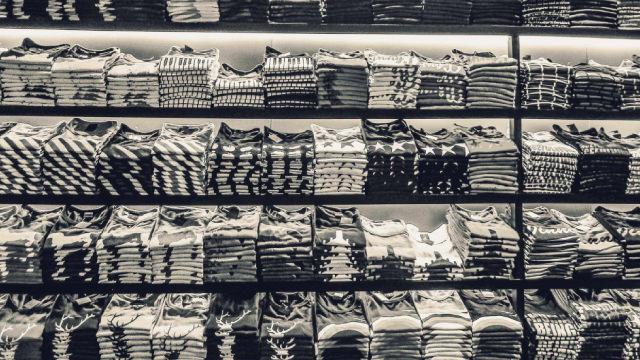
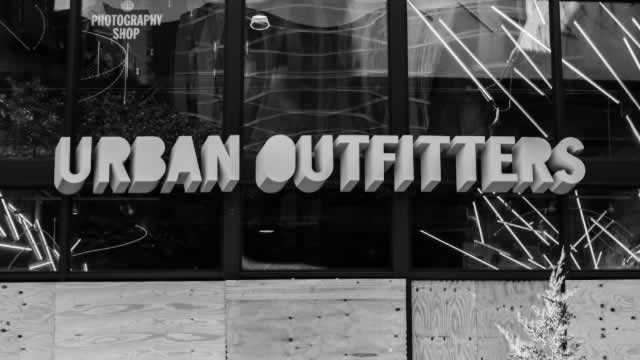
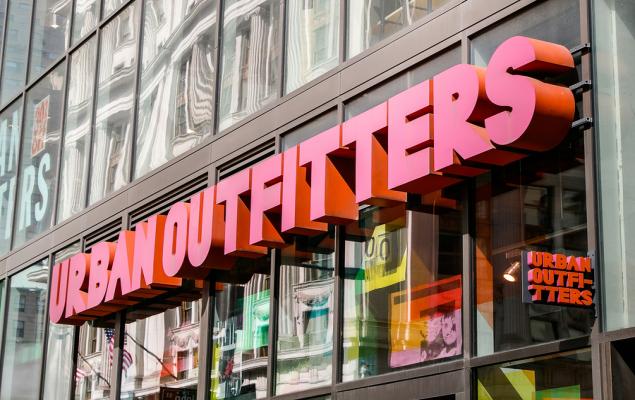
Urban Outfitters, Inc. engages in the retail and wholesale of general consumer products. The company operates through three segments: Retail, Wholesale, and Nully. It operates Urban Outfitters stores, which offer women's and men's fashion apparel, activewear, intimates, footwear, accessories, home goods, electronics, and beauty products for young adults aged 18 to 28; and Anthropologie stores that provide women's casual apparel, accessories, intimates, shoes, and home furnishings, as well as gifts, decorative items, and beauty and wellness products for women aged 28 to 45. The company also operates Bhldn stores, which offer heirloom quality wedding gowns, bridesmaid frocks, party dresses, assorted jewelry, headpieces, footwear, lingerie, and decorations; and Terrain stores that provide lifestyle home products, garden and outdoor living products, antiques, live plants, flowers, wellness products, and accessories. In addition, it operates Free People retail stores, which offer casual women's apparel, intimates, activewear, shoes, accessories, home products, gifts, and beauty and wellness products for young women aged 25 to 30; restaurants; and women's apparel subscription rental service under the Nuuly brand name. The company serves its customers directly through retail stores, Websites, mobile applications, catalogs and customer contact centers, franchised or third-party operated stores, and digital businesses. As of January 31, 2022, it operated 261 Urban Outfitters, 238 Anthropologie Group, and 173 Free People stores in the United States, Canada, and Europe; and 10 restaurants, as well as two Urban Outfitters and one Anthropologie franchisee-owned stores. The company is also involved in the wholesale of young women's contemporary casual apparel, intimates, activewear, and shoes under the Free People brand; and home goods through department and specialty stores worldwide. The company was founded in 1970 and is based in Philadelphia, Pennsylvania.