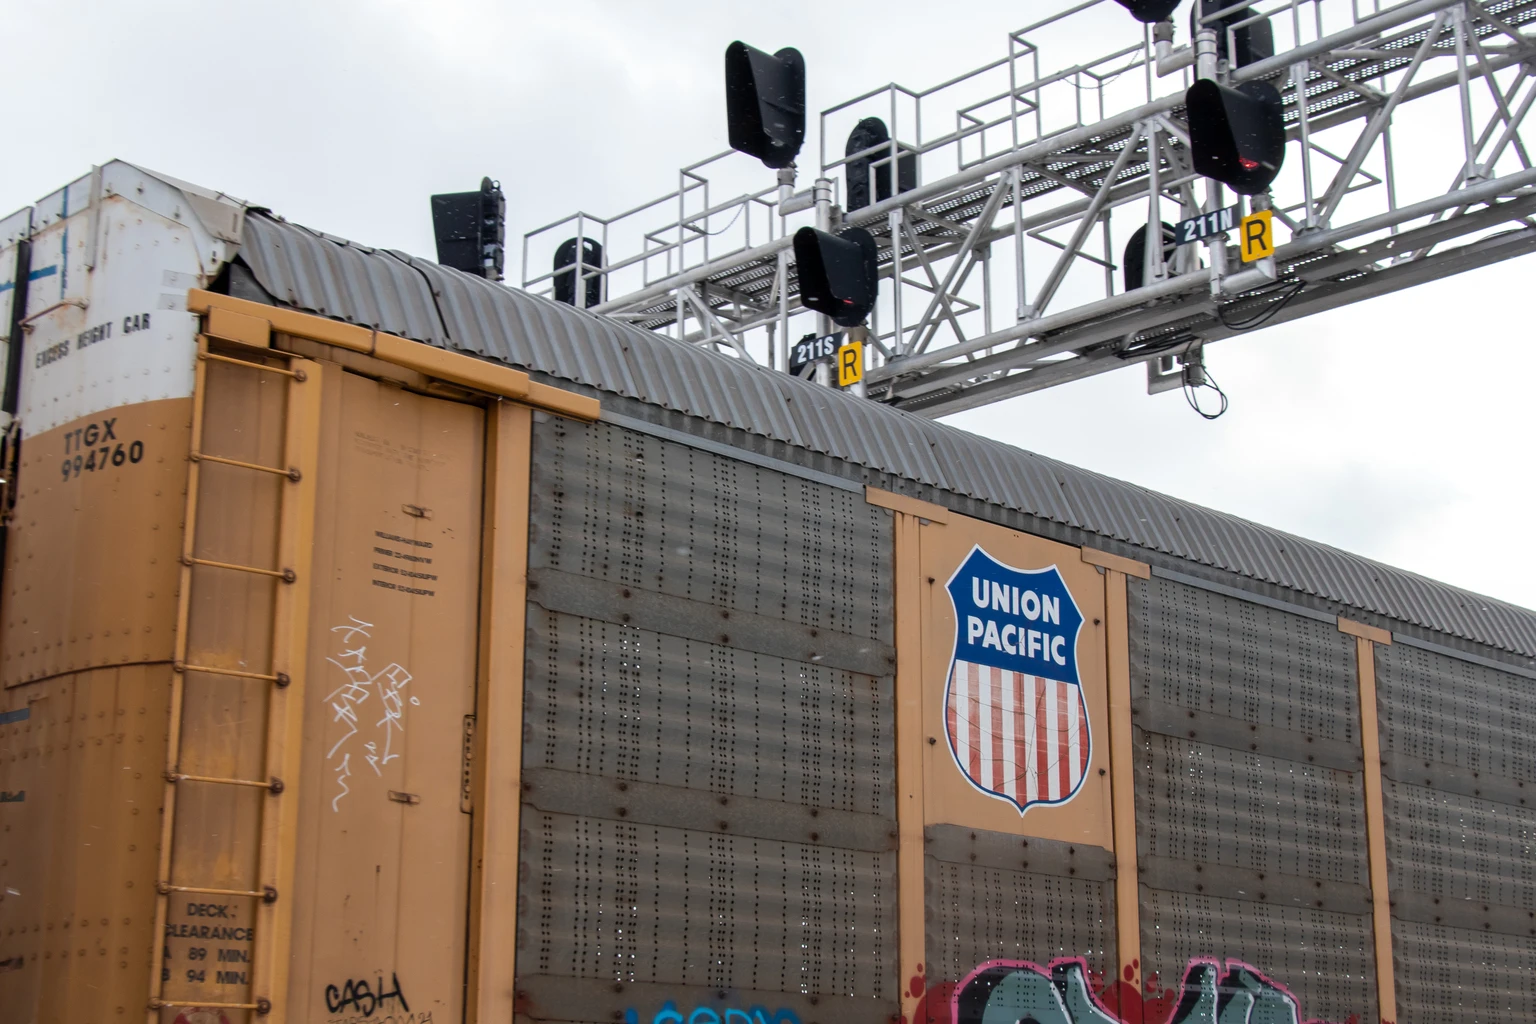
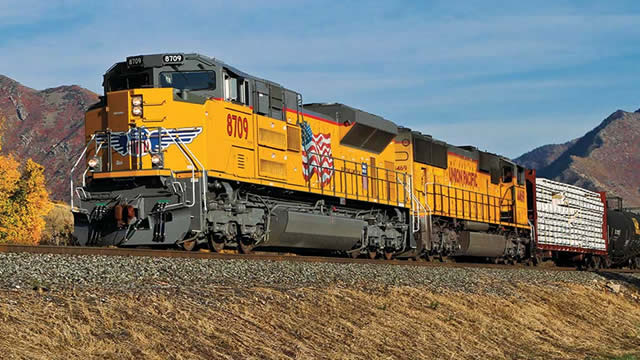
New

Chrome Plugin Live! Redefine the way you read FinTwit 🚀 Install Now

You have successfully sign out
Loading...
Shape
Union Pacific Corporation
UNP
Shape
US Flag

NYSE

142B

Railroads

Next Earning date - 23 Jan 2025

142B

Railroads

Next Earning date - 23 Jan 2025

234.26USD
Shape-0.63 ( -0.27%)
Market Open
favorite-chart

Relative Strenght

29
favorite-chart

Volume Buzz

-19%
favorite-chart

Earning Acce

Yes
favorite-chart

Dist 52w H.

9%

Quote Panel

Shape
Updated January 20, 2025
1W % 1M % 3M % 1Y %

Key Metrics

Shape
  • Market Cap


  • Shares Outstanding


  • Share in Float


  • Dividende


  • Earning Date

    No Data


  • Price Target


  • Average Volume


  • Beta


  • Range


  • Industry


  • Website


  • Sector


Fundamentals

Shape

Relative Strength

Shape

UNP

Sector

loading...

Top 5 RS in Group

Symbol

Company

RS

5-Day Perf.

Forecast

Shape

$25B

Shape312%

2025-Revenue

$12.05

Shape338%

2025-EPS

$13B

Shape317%

2025-EBITDA

Analyst rating

Strong Sell

Sell

Buy

Neutral

Strong Buy

Shape

Buy

Price Target

265.00(13.12%)

Number of analyst

2

Last analyst upgrade/downgrade

Citigroup

initialise

Previous: Buy

2024-10-08

Now: Neutral

Evercore ISI

downgrade

Previous: Outperform

2024-09-25

Now: Buy

Loop Capital Markets

downgrade

Previous: Not converted

2024-06-17

Now: Hold

Jefferies

initialise

Previous: Not converted

2024-04-08

Now: Hold

Earnings GrowthShape

status-upYoY

Current

Estimates

Q4.22

arrow
arrow

+0%

2.67
vs 2.66

Q1.23

arrow
arrow

+4%

2.67
vs 2.57

Q2.23

arrow
arrow

-12%

2.57
vs 2.93

Q3.23

arrow
arrow

-21%

2.51
vs 3.19

Q4.23

arrow
arrow

+2%

2.71
vs 2.67

Q1.24

arrow
arrow

+1%

2.69
vs 2.67

Q2.24

arrow
arrow

+7%

2.74
vs 2.57

Q3.24

arrow
arrow

+10%

2.75
vs 2.51

Q4.24

arrow
arrow

+3%

2.79
vs 2.71

Q1.25

arrow
arrow

+3%

2.77
vs 2.69

Sales GrowthShape

status-upYoY

Current

Estimates

Q4.22

arrow
arrow

+8%

6.2B  vs 5.7B

Q1.23

arrow
arrow

+3%

6.1B  vs 5.9B

Q2.23

arrow
arrow

-5%

6B  vs 6.3B

Q3.23

arrow
arrow

-10%

5.9B  vs 6.6B

Q4.23

arrow
arrow

0%

6.2B  vs 6.2B

Q1.24

arrow
arrow

0%

6B  vs 6.1B

Q2.24

arrow
arrow

+1%

6B  vs 6B

Q3.24

arrow
arrow

+3%

6.1B  vs 5.9B

Q4.24

arrow
arrow

0%

6.1B  vs 6.2B

Q1.25

arrow
arrow

+1%

6.1B  vs 6B

Return on EquityShape

status-upQoQ

Q4.22

arrow
arrow

+13%

0.13
vs 0.16

Q1.23

arrow
arrow

+13%

0.13
vs 0.13

Q2.23

arrow
arrow

+12%

0.12
vs 0.13

Q3.23

arrow
arrow

+11%

0.11
vs 0.12

Q4.23

arrow
arrow

+11%

0.11
vs 0.11

Q1.24

arrow
arrow

+10%

0.1
vs 0.11

Q2.24

arrow
arrow

+10%

0.1
vs 0.1

Q3.24

arrow
arrow

+10%

0.1
vs 0.1

Institutionnal OwnershipShape

status-upQoQ

Q4.22

arrow
arrow

2478

2.5K
vs 2.4K

4%

Q1.23

arrow
arrow

2433

2.4K
vs 2.5K

-2%

Q2.23

arrow
arrow

2471

2.5K
vs 2.4K

2%

Q3.23

arrow
arrow

2459

2.5K
vs 2.5K

0%

Q4.23

arrow
arrow

2627

2.6K
vs 2.5K

7%

Q1.24

arrow
arrow

2665

2.7K
vs 2.6K

1%

Q2.24

arrow
arrow

2605

2.6K
vs 2.7K

-2%

Q3.24

arrow
arrow

2654

2.7K
vs 2.6K

2%

Earnings Growth

Latest News