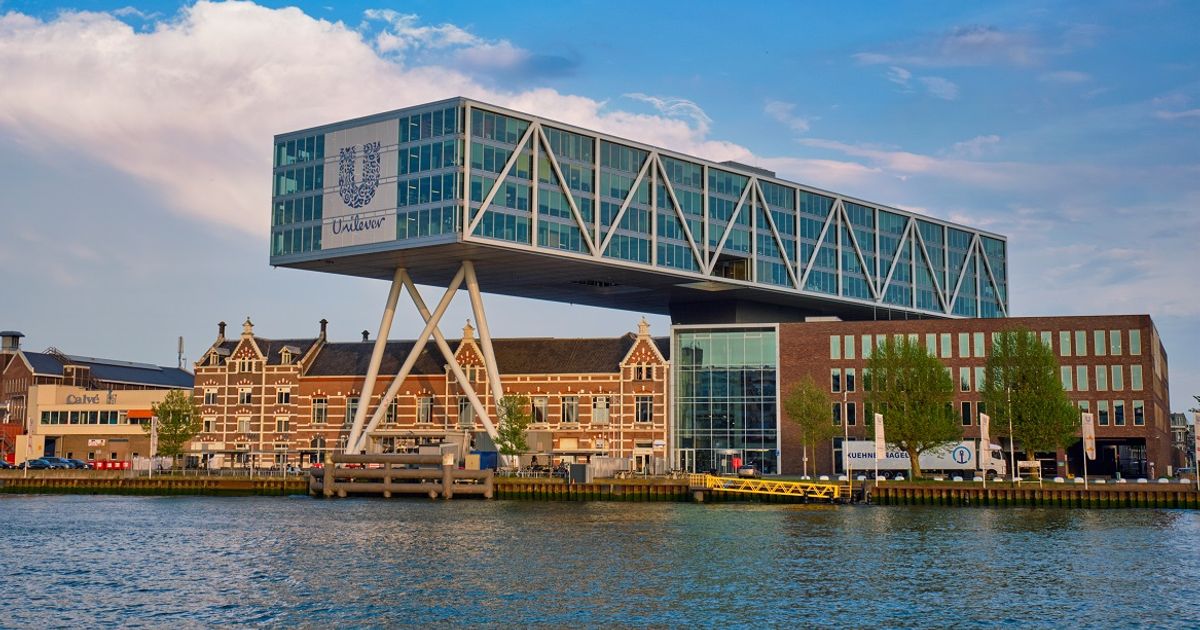
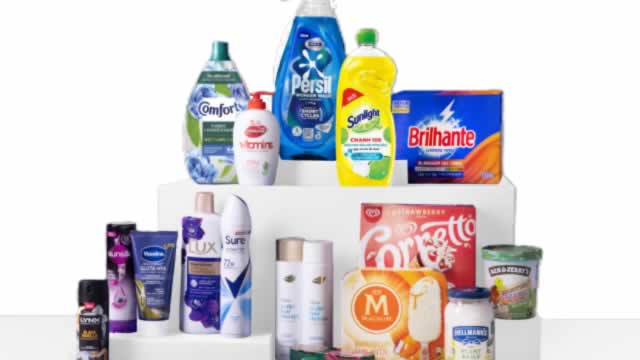
New

Chrome Plugin Live! Redefine the way you read FinTwit 🚀 Install Now

You have successfully sign out
Loading...
Shape
Unilever PLC
UL
Shape
US Flag

NYSE

135B

Household & Personal Products

Next Earning date - 13 Feb 2025

135B

Household & Personal Products

Next Earning date - 13 Feb 2025

54.72USD
Shape-0.02 ( -0.04%)
Market Open
favorite-chart

Relative Strenght

43
favorite-chart

Volume Buzz

4%
favorite-chart

Earning Acce

No
favorite-chart

Dist 52w H.

17%

Quote Panel

Shape
Updated January 16, 2025
1W -0.74 % 1M -7.72 % 3M -12.28 % 1Y 18.49 %

Key Metrics

Shape
  • Market Cap

    135.46B


  • Shares Outstanding

    2.48B


  • Share in Float

    2.48B


  • Dividende

    1.8666


  • Earning Date

    13 Feb 2025


  • Price Target

    54.72


  • Average Volume

    2.23M


  • Beta

    0.235


  • Range

    46.46-65.87


  • Industry

    Household & Personal Products


  • Website

    https://www.unilever.com


  • Sector

    Consumer Defensive


Fundamentals

Shape

Relative Strength

Shape

UL

Sector

loading...

Top 5 RS in Group

Symbol

Company

RS

5-Day Perf.

Forecast

Shape

$65B

Shape110%

2025-Revenue

$3.26

Shape122%

2025-EPS

$13B

Shape91%

2025-EBITDA

Analyst rating

Strong Sell

Sell

Buy

Neutral

Strong Buy

Shape

Buy

Price Target

0.00(-100.00%)

Number of analyst

0

Last analyst upgrade/downgrade

Bernstein

upgrade

Previous: Not converted

2025-01-09

Now: Outperform

Bank of America Securities

upgrade

Previous: Not converted

2024-08-22

Now: Buy

Cowen & Co.

initialise

Previous: Not converted

2024-07-22

Now: Buy

Wedbush

downgrade

Previous: Not converted

2022-12-02

Now: Neutral

Earnings GrowthShape

status-upYoY

Current

Estimates

Q2.20

arrow
arrow

+8%

1.41
vs 1.3

Q4.20

arrow
arrow

-5%

1.07
vs 1.13

Q2.21

arrow
arrow

N/A

1.41
vs 1.41

Q4.21

arrow
arrow

+20%

1.28
vs 1.07

Q2.22

arrow
arrow

-16%

1.18
vs 1.41

Q4.22

arrow
arrow

+56%

2
vs 1.28

Q2.23

arrow
arrow

+30%

1.53
vs 1.18

Q4.23

arrow
arrow

-36%

1.28
vs 2

Q2.24

arrow
arrow

+3%

1.58
vs 1.53

Q4.24

arrow
arrow

+11%

1.43
vs 1.28

Sales GrowthShape

status-upYoY

Current

Estimates

Q4.20

arrow
arrow

-3%

25B  vs 25.9B

Q2.21

arrow
arrow

+0%

25.8B  vs 25.7B

Q4.21

arrow
arrow

+7%

26.7B  vs 25B

Q2.22

arrow
arrow

+15%

29.6B  vs 25.8B

Q4.22

arrow
arrow

+14%

30.4B  vs 26.7B

Q2.23

arrow
arrow

+3%

30.4B  vs 29.6B

Q4.23

arrow
arrow

-4%

29.2B  vs 30.4B

Q2.24

arrow
arrow

+2%

31.1B  vs 30.4B

Q4.24

arrow
arrow

-40%

17.4B  vs 29.2B

Q1.25

arrow
arrow

NA

18.3B  vs NA

Return on EquityShape

status-upQoQ

Q4.20

arrow
arrow

+15%

0.15
vs 0.21

Q2.21

arrow
arrow

+18%

0.18
vs 0.15

Q4.21

arrow
arrow

+17%

0.17
vs 0.18

Q2.22

arrow
arrow

+14%

0.14
vs 0.17

Q4.22

arrow
arrow

+25%

0.25
vs 0.14

Q2.23

arrow
arrow

+18%

0.18
vs 0.25

Q4.23

arrow
arrow

+16%

0.16
vs 0.18

Q2.24

arrow
arrow

+18%

0.18
vs 0.16

Institutionnal OwnershipShape

status-upQoQ

Q4.22

arrow
arrow

1118

1.1K
vs 1K

9%

Q1.23

arrow
arrow

1114

1.1K
vs 1.1K

0%

Q2.23

arrow
arrow

1092

1.1K
vs 1.1K

-2%

Q3.23

arrow
arrow

1081

1.1K
vs 1.1K

-1%

Q4.23

arrow
arrow

1118

1.1K
vs 1.1K

3%

Q1.24

arrow
arrow

1107

1.1K
vs 1.1K

-1%

Q2.24

arrow
arrow

1119

1.1K
vs 1.1K

1%

Q3.24

arrow
arrow

1179

1.2K
vs 1.1K

5%

Earnings Growth

Latest News