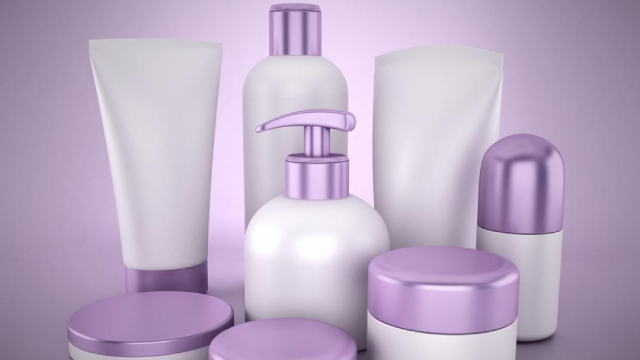
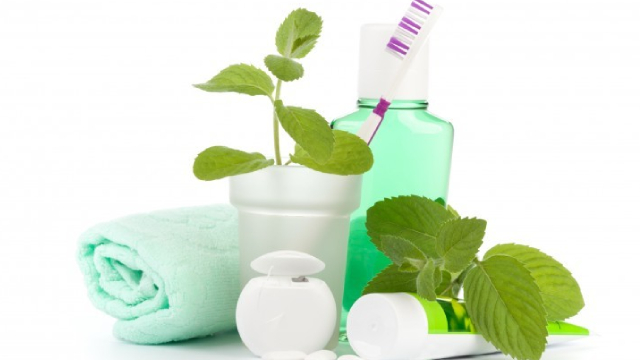
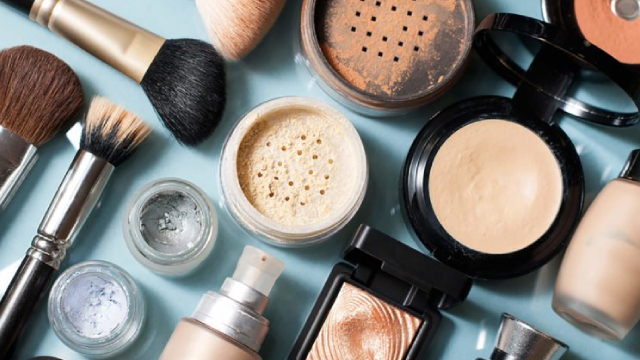
United-Guardian, Inc. manufactures and markets cosmetic ingredients, pharmaceuticals, medical lubricants, and proprietary specialty industrial products in the United States and internationally. The company offers cosmetic ingredients, including LUBRAJEL line of water-based moisturizing and lubricating gel formulations; LUBRAJEL NATURAL consisting of natural ingredients for cosmetic use; LUBRAJEL MARINE; LUBRASIL II SB, a special formulation of LUBRAJEL in which silicone oil is incorporated into a LUBRAJEL base; LUBRAJEL II XD; B-122, a powdered lubricant that is used in the manufacture of pressed powders, eyeliners, rouges, and industrial products; KLENSOFT, a surfactant, which is used in shampoos, shower gels, makeup removers, and other cosmetic formulations; and ORCHID COMPLEX, an oil-soluble base for skin creams, lotions, cleansers, and other cosmetics. Its medical lubricants comprise LUBRAJEL RR and RC, which are water-based lubricant gels for urinary catheters; LUBRAJEL MG to lubricate urinary catheters, pre-lubricated enema tips, and other medical devices; LUBRAJEL LC and LUBRAJEL FA that are LUBRAJEL formulations for oral care; and LUBRAJEL FLUID to lubricate water-soluble products. The company's pharmaceutical products consist of RENACIDIN, a prescription drug to prevent and dissolve calcifications in urethral catheters and the urinary bladder; and CLORPACTIN WCS-90, an antimicrobial product to treat infections in the urinary bladder, and localized infections in the peritoneum, as well as eye, ear, nose and throat, and sinuses. Its industrial products include DESELEX, a sequestering and chelating agent used for manufacturing detergents; and THOROCLENS, a chlorine-based industrial cleanser. The company also conducts research and development primarily related to the development of cosmetic ingredients. It markets its products through marketing partners, distributors, and wholesalers. The company was founded in 1942 and is based in Hauppauge, New York.