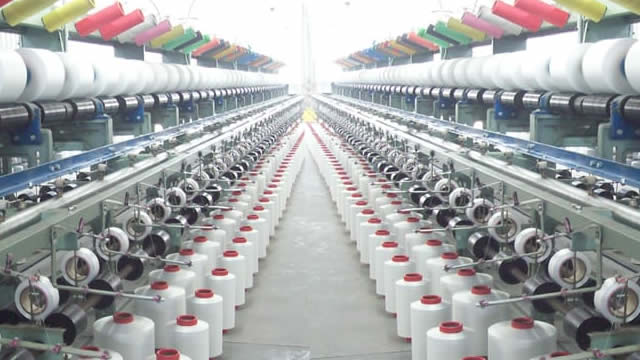
Unifi, Inc., together with its subsidiaries, engages in the manufacture and sale of recycled and synthetic products in the United States, Brazil, China, and internationally. It operates in four segments: Polyester, Nylon, Brazil, and Asia. The Polyester segment offers partially oriented, textured, solution and package dyed, twisted, beamed, and draw wound yarns; and pre-consumer and post-consumer waste products, including plastic bottle flakes, polyester polymer, and staple fiber beads to other yarn manufacturers, and knitters and weavers that produce yarn and/or fabric for the apparel, hosiery, home furnishings, automotive, industrial, and other end-use markets. The Nylon segment provides virgin or recycled textured, solution dyed, and spandex covered yarns to knitters and weavers that produce fabric primarily for the apparel, hosiery, medical markets. The Brazil segment manufactures and sells polyester-based products to knitters and weavers that produce fabric for the apparel, home furnishings, automotive, industrial, and other end-use markets. The Asia segment primarily sells polyester-based products to knitters and weavers that produce fabric for the apparel, home furnishings, automotive, industrial, and other end-use markets. The company sells its products through sales force and independent sales agents under the REPREVE and PROFIBER brands. Unifi, Inc. was incorporated in 1969 and is headquartered in Greensboro, North Carolina.