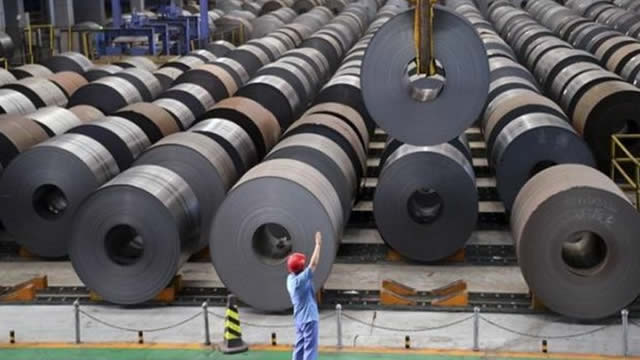
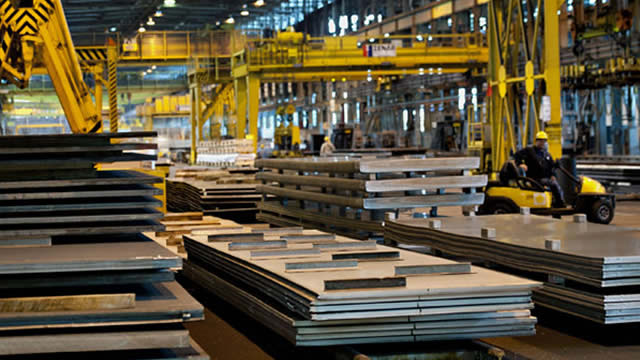
New

Chrome Plugin Live! Redefine the way you read FinTwit 🚀 Install Now

You have successfully sign out
Loading...
Shape
Ternium S.A.
TX
Shape
US Flag

NYSE

EPS improving

EPS improving

646M

Steel

Next Earning date - 23 Apr 2025

646M

Steel

Next Earning date - 23 Apr 2025

31.36USD

Shape0.53 ( 1.72%)
Market Closed (as of Mar 07, 21:00 EDT)
favorite-chart

Relative Strenght

39
favorite-chart

Volume Buzz

-26%
favorite-chart

Earning Acce

No
favorite-chart

Dist 52w H.

29%

Quote Panel

Shape
Updated March 15, 2025
1W 4.40 % 1M 5.04 % 3M 10.20 % 1Y -10.56 %

Key Metrics

Shape
  • Market Cap

    646.44M


  • Shares Outstanding

    19.63M


  • Share in Float

    36.92M


  • Dividende

    3.1


  • Earning Date

    23 Apr 2025


  • Price Target

    32.93


  • Average Volume

    256735


  • Beta

    1.653


  • Range

    28-44.44


  • Industry

    Steel


  • Website

    https://www.ternium.com


  • Sector

    Basic Materials


Fundamentals

Shape

Relative Strength

Shape

TX

Sector

loading...

Top 5 RS in Group

Symbol

Company

RS

5-Day Perf.

Forecast

Shape

$17B

Shape288%

2025-Revenue

$5.22

Shape32539%

2025-EPS

$4B

Shape702%

2025-EBITDA

Analyst rating

Strong Sell

Sell

Buy

Neutral

Strong Buy

Shape

Buy

Price Target

32.00(-2.82%)

Number of analyst

1

Last analyst upgrade/downgrade

UBS

initialise

Previous: Not converted

2025-03-12

Now: Neutral

Bank of America Securities

upgrade

Previous: Not converted

2023-11-20

Now: Buy

Morgan Stanley

upgrade

Previous: Not converted

2023-03-06

Now: Overweight

Earnings GrowthShape

status-upYoY

Current

Estimates

Q4.22

arrow
arrow

-96%

0.2
vs 5.08

Q1.23

arrow
arrow

-52%

1.91
vs 3.95

Q2.23

arrow
arrow

-22%

3.19
vs 4.07

Q3.23

arrow
arrow

+77%

1.38
vs 0.78

Q4.23

arrow
arrow

+955%

2.11
vs 0.2

Q1.24

arrow
arrow

-4%

1.84
vs 1.91

Q2.24

arrow
arrow

N/A

-0.11
vs 3.19

Q3.24

arrow
arrow

-88%

0.16
vs 1.38

Q4.24

arrow
arrow

-65%

0.74
vs 2.11

Q1.25

arrow
arrow

-63%

0.69
vs 1.84

Sales GrowthShape

status-upYoY

Current

Estimates

Q4.22

arrow
arrow

-18%

3.5B  vs 4.3B

Q1.23

arrow
arrow

-16%

3.6B  vs 4.3B

Q2.23

arrow
arrow

-13%

3.9B  vs 4.4B

Q3.23

arrow
arrow

+26%

5.2B  vs 4.1B

Q4.23

arrow
arrow

+40%

4.9B  vs 3.5B

Q1.24

arrow
arrow

+31%

4.7B  vs 3.6B

Q2.24

arrow
arrow

+16%

4.5B  vs 3.9B

Q3.24

arrow
arrow

-15%

4.4B  vs 5.2B

Q4.24

arrow
arrow

-15%

4.2B  vs 4.9B

Q1.25

arrow
arrow

-15%

4.1B  vs 4.7B

Return on EquityShape

status-upQoQ

Q4.22

arrow
arrow

+0%

0
vs 0.02

Q1.23

arrow
arrow

+3%

0.03
vs 0

Q2.23

arrow
arrow

+5%

0.05
vs 0.03

Q3.23

arrow
arrow

-6%

-0.06
vs 0.05

Q4.23

arrow
arrow

+3%

0.03
vs -0.06

Q1.24

arrow
arrow

+3%

0.03
vs 0.03

Q2.24

arrow
arrow

-6%

-0.06
vs 0.03

Q3.24

arrow
arrow

+0%

0
vs -0.06

Institutionnal OwnershipShape

status-upQoQ

Q1.23

arrow
arrow

152

152
vs 147

3%

Q2.23

arrow
arrow

151

151
vs 152

-1%

Q3.23

arrow
arrow

161

161
vs 151

7%

Q4.23

arrow
arrow

173

173
vs 161

7%

Q1.24

arrow
arrow

171

171
vs 173

-1%

Q2.24

arrow
arrow

153

153
vs 171

-11%

Q3.24

arrow
arrow

148

148
vs 153

-3%

Q4.24

arrow
arrow

126

126
vs 148

-15%

Earnings Growth

Latest News