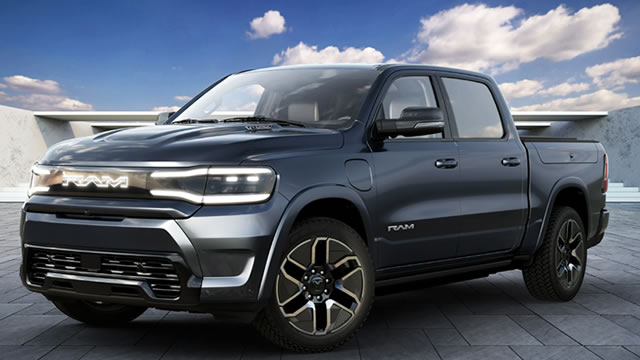
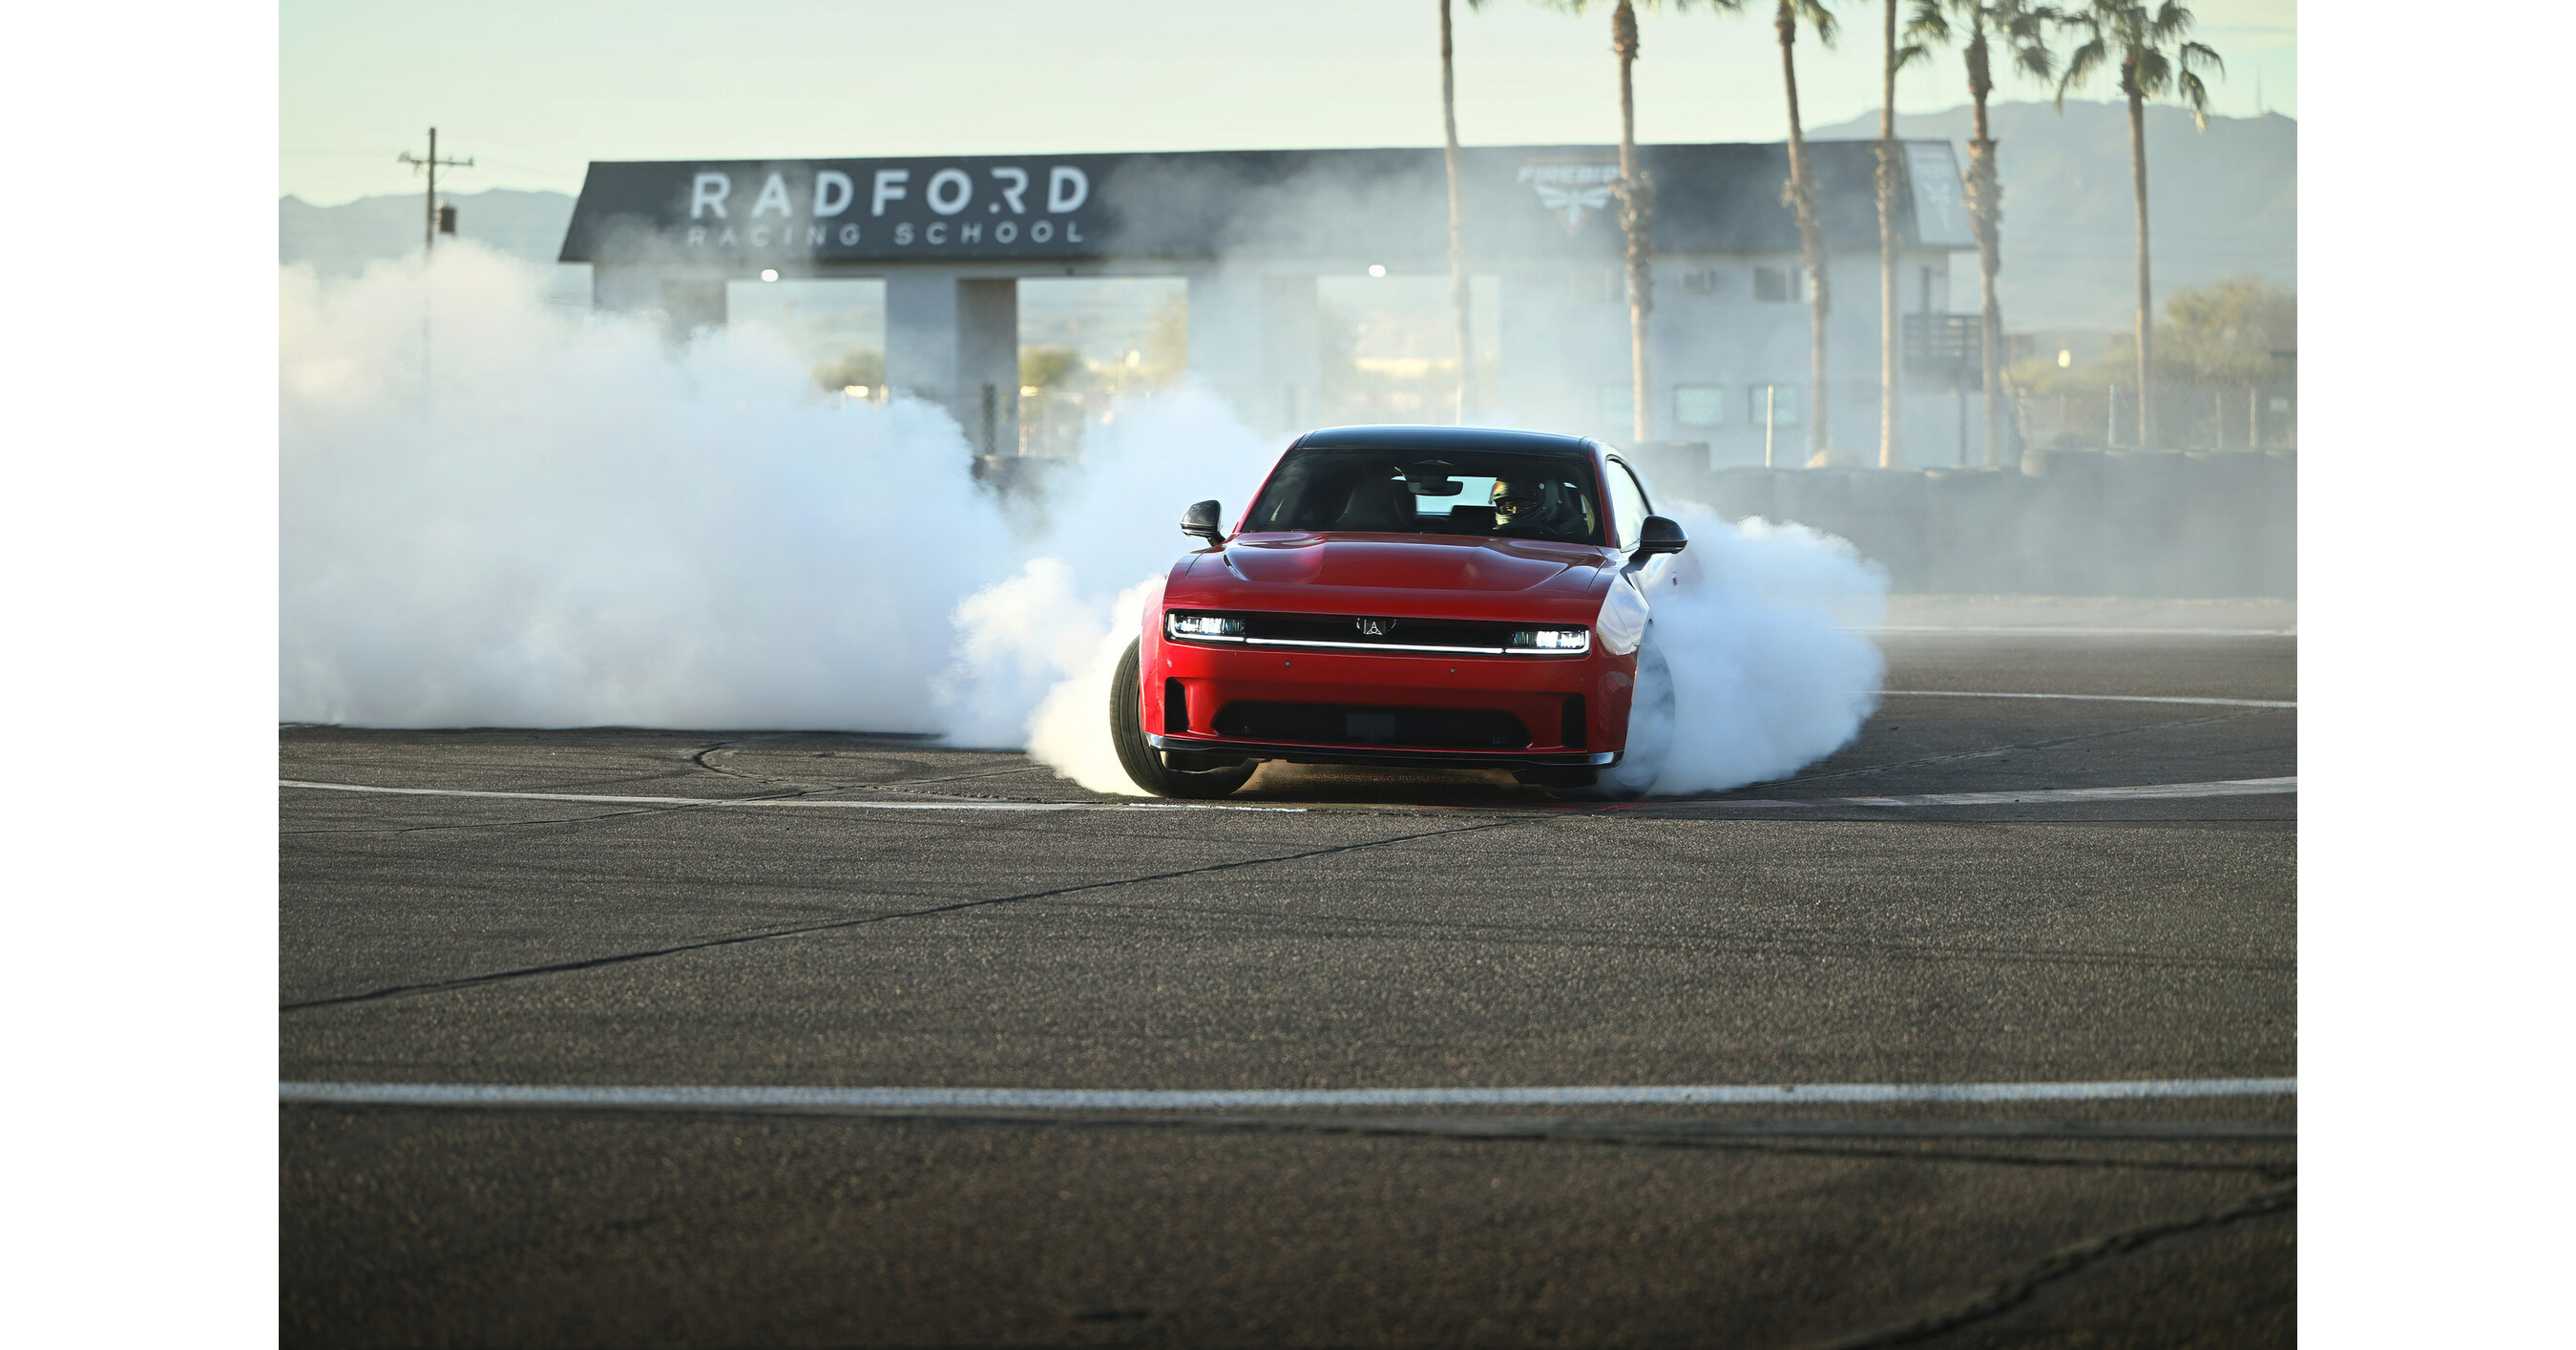
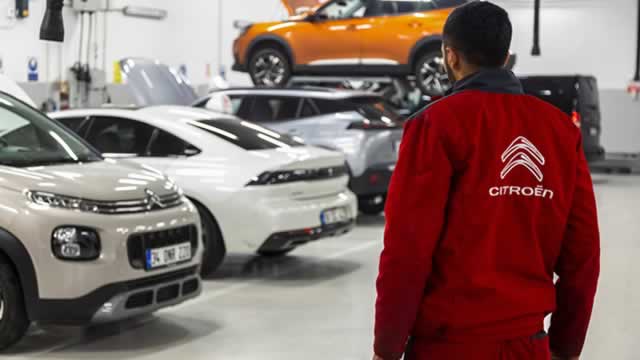
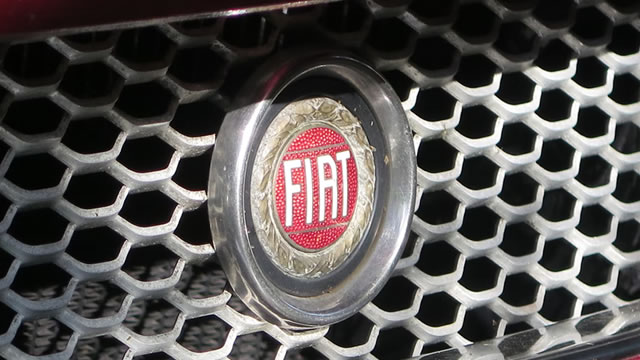
New

Chrome Plugin Live! Redefine the way you read FinTwit 🚀 Install Now

You have successfully sign out
Loading...
Shape
Stellantis N.V.
STLA
Shape
US Flag

NYSE

37B

Auto - Manufacturers

Next Earning date - 13 Feb 2025

37B

Auto - Manufacturers

Next Earning date - 13 Feb 2025

12.56USD
Shape-0.19 ( -1.49%)
Market Open
favorite-chart

Relative Strenght

9
favorite-chart

Volume Buzz

-11%
favorite-chart

Earning Acce

No
favorite-chart

Dist 52w H.

57%

Quote Panel

Shape
Updated January 17, 2025
1W % 1M % 3M % 1Y %

Key Metrics

Shape
  • Market Cap


  • Shares Outstanding


  • Share in Float


  • Dividende


  • Earning Date

    No Data


  • Price Target


  • Average Volume


  • Beta


  • Range


  • Industry


  • Website


  • Sector


Fundamentals

Shape

Relative Strength

Shape

STLA

Sector

loading...

Top 5 RS in Group

Symbol

Company

RS

5-Day Perf.

Forecast

Shape

Analyst rating

Last analyst upgrade/downgrade

Earnings GrowthShape

status-upYoY

Current

Estimates

Q2.20

arrow
arrow

N/A

-0.65
vs 0.5

Q4.20

arrow
arrow

+43%

1.39
vs 0.97

Q2.21

arrow
arrow

+486%

2.51
vs -0.65

Q4.21

arrow
arrow

+94%

2.69
vs 1.39

Q2.22

arrow
arrow

+3%

2.58
vs 2.51

Q4.22

arrow
arrow

N/A

NA
vs 2.69

Q2.23

arrow
arrow

+46%

3.77
vs 2.58

Q4.23

arrow
arrow

N/A

2.72
vs NA

Q2.24

arrow
arrow

-45%

2.06
vs 3.77

Q4.24

arrow
arrow

-73%

0.73
vs 2.72

Sales GrowthShape

status-upYoY

Current

Estimates

Q4.20

arrow
arrow

-5%

28B  vs 29.6B

Q2.21

arrow
arrow

+520%

72.6B  vs 11.7B

Q4.21

arrow
arrow

+174%

76.8B  vs 28B

Q2.22

arrow
arrow

+21%

88B  vs 72.6B

Q4.22

arrow
arrow

+19%

91.6B  vs 76.8B

Q2.23

arrow
arrow

+12%

98.4B  vs 88B

Q4.23

arrow
arrow

0%

91.2B  vs 91.6B

Q2.24

arrow
arrow

-14%

85B  vs 98.4B

Q3.24

arrow
arrow

NA

30.3B  vs NA

Q4.24

arrow
arrow

-67%

30.2B  vs 91.2B

Return on EquityShape

status-upQoQ

Q4.20

arrow
arrow

+6%

0.06
vs -0.04

Q2.21

arrow
arrow

+15%

0.15
vs 0.06

Q4.21

arrow
arrow

+13%

0.13
vs 0.15

Q2.22

arrow
arrow

+12%

0.12
vs 0.13

Q4.22

arrow
arrow

+12%

0.12
vs 0.12

Q2.23

arrow
arrow

+14%

0.14
vs 0.12

Q4.23

arrow
arrow

+9%

0.09
vs 0.14

Q2.24

arrow
arrow

+7%

0.07
vs 0.09

Institutionnal OwnershipShape

status-upQoQ

Q4.22

arrow
arrow

387

387
vs 355

9%

Q1.23

arrow
arrow

410

410
vs 387

6%

Q2.23

arrow
arrow

431

431
vs 410

5%

Q3.23

arrow
arrow

445

445
vs 431

3%

Q4.23

arrow
arrow

496

496
vs 445

11%

Q1.24

arrow
arrow

530

530
vs 496

7%

Q2.24

arrow
arrow

500

500
vs 530

-6%

Q3.24

arrow
arrow

483

483
vs 500

-3%

Earnings Growth

Latest News