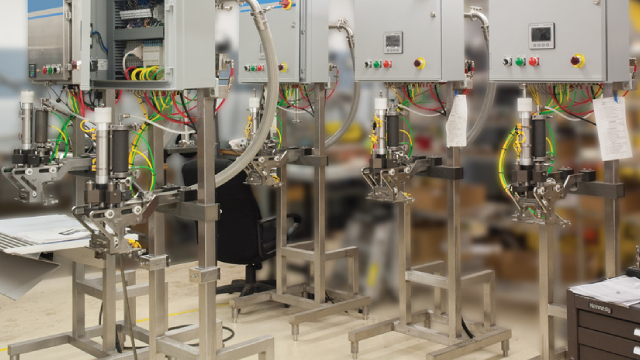
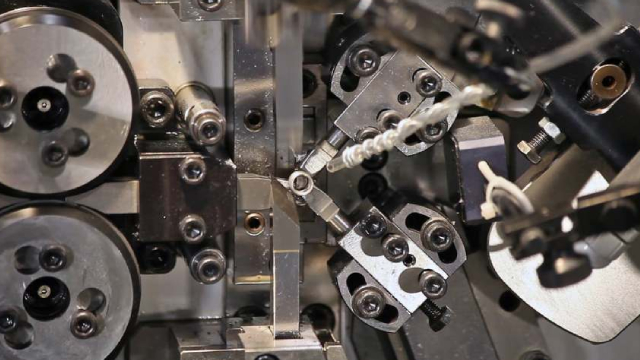
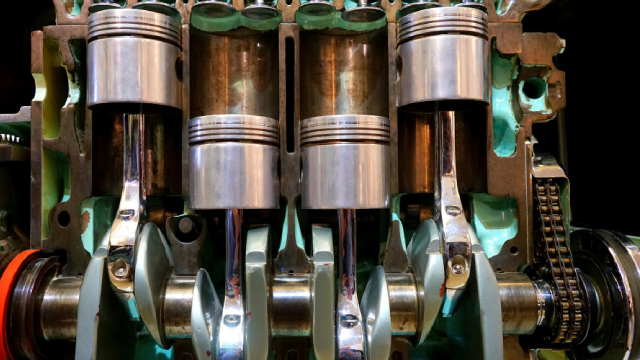
New

Chrome Plugin Live! Redefine the way you read FinTwit 🚀 Install Now

You have successfully sign out
Loading...
Shape
Sensata Technologies Holding plc
ST
Shape
US Flag

NYSE

4B

Hardware, Equipment & Parts

Next Earning date - 28 Apr 2025

4B

Hardware, Equipment & Parts

Next Earning date - 28 Apr 2025

28.01USD

Shape2.21 ( 8.57%)
Market Closed (as of Feb 12, 21:00 EDT)
favorite-chart

Relative Strenght

7
favorite-chart

Volume Buzz

178%
favorite-chart

Earning Acce

No
favorite-chart

Dist 52w H.

35%

Quote Panel

Shape
Updated February 13, 2025
1W 8.82 % 1M 1.45 % 3M -14.13 % 1Y -13.60 %

Key Metrics

Shape
  • Market Cap

    4.19B


  • Shares Outstanding

    149.57M


  • Share in Float

    147.72M


  • Dividende

    0.6


  • Earning Date

    28 Apr 2025


  • Price Target

    28.01


  • Average Volume

    1.65M


  • Beta

    1.253


  • Range

    24.91-43.14


  • Industry

    Hardware, Equipment & Parts


  • Website

    https://www.sensata.com


  • Sector

    Technology


Fundamentals

Shape

Relative Strength

Shape

ST

Sector

loading...

Top 5 RS in Group

Symbol

Company

RS

5-Day Perf.

Forecast

Shape

$4B

Shape309%

2025-Revenue

$3.32

Shape8478%

2025-EPS

$734M

Shape895%

2025-EBITDA

Analyst rating

Strong Sell

Sell

Buy

Neutral

Strong Buy

Shape

Buy

Price Target

0.00(-100.00%)

Number of analyst

0

Last analyst upgrade/downgrade

Vertical Research

initialise

Previous: Not converted

2024-07-23

Now: Buy

Evercore ISI

upgrade

Previous: Not converted

2024-05-06

Now: Outperform

Goldman Sachs

downgrade

Previous: Buy

2024-04-09

Now: Neutral

Jefferies

initialise

Previous: Buy

2024-04-09

Now: Hold

Earnings GrowthShape

status-upYoY

Current

Estimates

Q4.22

arrow
arrow

+10%

0.96
vs 0.87

Q1.23

arrow
arrow

+18%

0.92
vs 0.78

Q2.23

arrow
arrow

+17%

0.97
vs 0.83

Q3.23

arrow
arrow

+7%

0.91
vs 0.85

Q4.23

arrow
arrow

-16%

0.81
vs 0.96

Q1.24

arrow
arrow

-3%

0.89
vs 0.92

Q2.24

arrow
arrow

-4%

0.93
vs 0.97

Q3.24

arrow
arrow

-5%

0.86
vs 0.91

Q4.24

arrow
arrow

-8%

0.75
vs 0.81

Q1.25

arrow
arrow

-15%

0.75
vs 0.89

Sales GrowthShape

status-upYoY

Current

Estimates

Q4.22

arrow
arrow

+9%

1B  vs 934.6M

Q1.23

arrow
arrow

+2%

998.2M  vs 975.8M

Q2.23

arrow
arrow

+4%

1.1B  vs 1B

Q3.23

arrow
arrow

-2%

1B  vs 1B

Q4.23

arrow
arrow

-2%

992.5M  vs 1B

Q1.24

arrow
arrow

+1%

1B  vs 998.2M

Q2.24

arrow
arrow

-2%

1B  vs 1.1B

Q3.24

arrow
arrow

-2%

983M  vs 1B

Q4.24

arrow
arrow

-11%

884.9M  vs 992.5M

Q1.25

arrow
arrow

-12%

888.4M  vs 1B

Return on EquityShape

status-upQoQ

Q1.23

arrow
arrow

+3%

0.03
vs 0.04

Q2.23

arrow
arrow

+2%

0.02
vs 0.03

Q3.23

arrow
arrow

+2%

0.02
vs 0.02

Q4.23

arrow
arrow

-7%

-0.07
vs 0.02

Q1.24

arrow
arrow

+3%

0.03
vs -0.07

Q2.24

arrow
arrow

+2%

0.02
vs 0.03

Q3.24

arrow
arrow

-846%

-8.46
vs 0.02

Q4.24

arrow
arrow

+0%

0
vs -8.46

Institutionnal OwnershipShape

status-upQoQ

Q4.22

arrow
arrow

384

384
vs 331

16%

Q1.23

arrow
arrow

365

365
vs 384

-5%

Q2.23

arrow
arrow

395

395
vs 365

8%

Q3.23

arrow
arrow

365

365
vs 395

-8%

Q4.23

arrow
arrow

379

379
vs 365

4%

Q1.24

arrow
arrow

365

365
vs 379

-4%

Q2.24

arrow
arrow

399

399
vs 365

9%

Q3.24

arrow
arrow

362

362
vs 399

-9%

Earnings Growth

Latest News