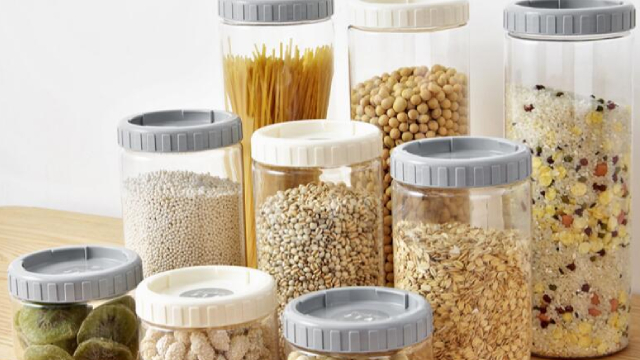
Silgan Holdings Inc., together with its subsidiaries, manufactures and sells rigid packaging for consumer goods products in North America, Europe, and internationally. It operates through three segments: Dispensing and Specialty Closures, Metal Containers, and Custom Containers. The Metal Containers segment manufactures and sells steel and aluminum containers for food products, such as pet food, vegetables, soups, proteins, tomato based products, adult nutritional drinks, fruits, and other miscellaneous food products, as well as general line metal containers primarily for chemicals. The Dispensing and Specialty Closures segment offers a range of metal and plastic closures, and dispensing systems for use in food, beverage, health care, garden, home, personal care, and beauty products, as well as capping/sealing equipment and detection systems. The Custom Containers segment manufactures and sells custom designed and stock plastic containers for use in personal care and health care; food and beverage; household and industrial chemical; pharmaceutical; pet food and care; agricultural; automotive; and marine chemical products. This segment also provides plastic thermoformed barrier and non-barrier bowls, and trays for food products, such as soups, other ready-to-eat meals, and pet food products; and plastic closures, caps, sifters, and fitments, as well as thermoformed tubs for food, household, and personal care products, including soft fabric wipes. The company markets its products primarily through direct sales force, as well as through a network of distributors and an online shopping catalog. Silgan Holdings Inc. was founded in 1987 and is headquartered in Stamford, Connecticut.