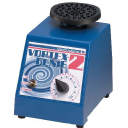
Scientific Industries, Inc. designs, manufactures, and markets benchtop laboratory equipment and bioprocessing systems worldwide. It offers vortex mixers to mix the contents of test tubes, beakers, and other containers by placing such containers on a rotating cup or other attachments; and various mixers and shakers, such as high speed touch mixers, mixers with an integral timer, cell disruptors, microplate mixers, vortex mixers incorporating digital control and display, multi-vessel vortex mixers, and orbital shakers. The company also provides benchtop multi-purpose rotators and rockers to rotate and rock various containers; refrigerated incubators and incubated shakers for shaking and stirring functions; and magnetic stirrers, including high/low programmable magnetic stirrers, four-place high/low programmable magnetic stirrers, large volume magnetic, and four-place general purpose stirrers. In addition, it offers bioprocessing systems comprising disposable sensors, such as coaster systems and other shaking products using vessels; and mechanical balances, moisture analyzers, pill counters, test stands, and force gauges, as well as pharmacy, laboratory, and industrial digital scales. The company's products are used for research purposes by universities, pharmaceutical companies, pharmacies, national laboratories, medical device manufacturers, petrochemical companies, and other industries performing laboratory-scale research. The company markets its products under the Genie and Torbal brand names directly, as well as through laboratory equipment distributors and online. Scientific Industries, Inc. was incorporated in 1954 and is headquartered in Bohemia, New York.