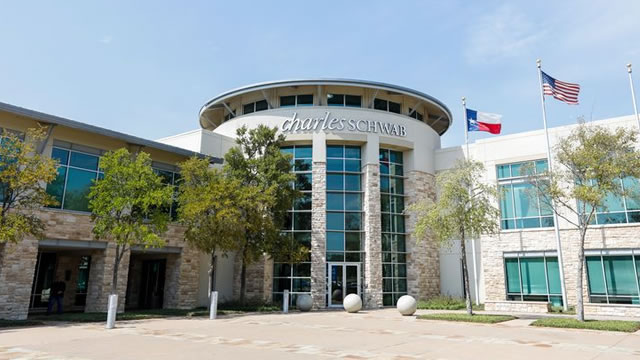
The Charles Schwab Corporation, together with its subsidiaries, provides wealth management, securities brokerage, banking, asset management, custody, and financial advisory services. The company operates in two segments, Investor Services and Advisor Services. The Investor Services segment provides retail brokerage, investment advisory, banking and trust, retirement plan, and other corporate brokerage services; equity compensation plan sponsors full-service recordkeeping for stock plans, stock options, restricted stock, performance shares, and stock appreciation rights; and retail investor and mutual fund clearing services, as well as compliance solutions. The Advisor Services segment offers custodial, trading, banking, and support services; and retirement business and corporate brokerage retirement services. This segment provides brokerage accounts with equity and fixed income, margin lending, options, and futures and forex trading; cash management capabilities comprising third-party certificates of deposit; third-party and proprietary mutual funds; plus mutual fund trading and clearing services; and exchange-traded funds (ETFs), including proprietary and third-party ETFs. It also offers advice solutions, such as managed portfolios of proprietary and third-party mutual funds and ETFs, separately managed accounts, customized personal advice for tailored portfolios, and specialized planning and portfolio management. In addition, this segment provides banking products and services, including checking and savings accounts, first lien residential real estate mortgage loans, home equity lines of credit, and pledged asset lines; and trust services comprising trust custody services, personal trust reporting services, and administrative trustee services. As of December 31, 2021, the Company had approximately 400 domestic branch offices in 48 states and the District of Columbia, as well as locations in Puerto Rico, the United Kingdom, Hong Kong, and Singapore. The Charles Schwab Corporation was incorporated in 1971 and is headquartered in Westlake, Texas.