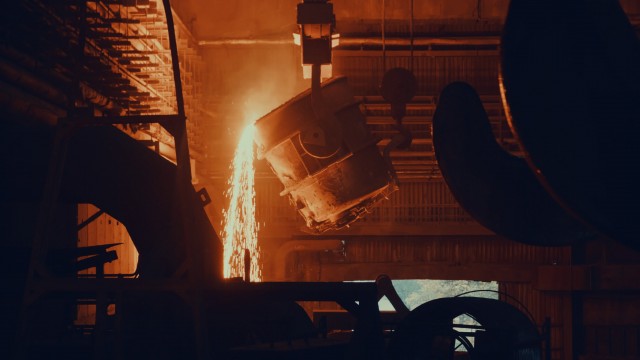
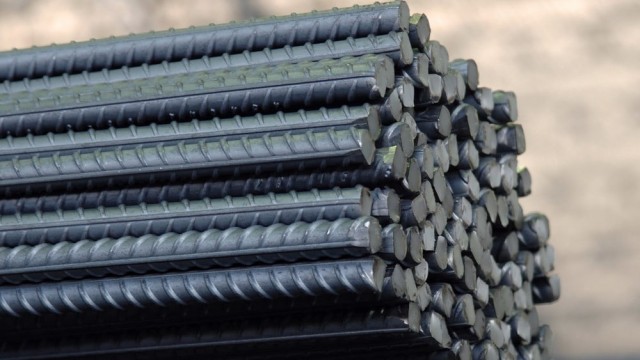
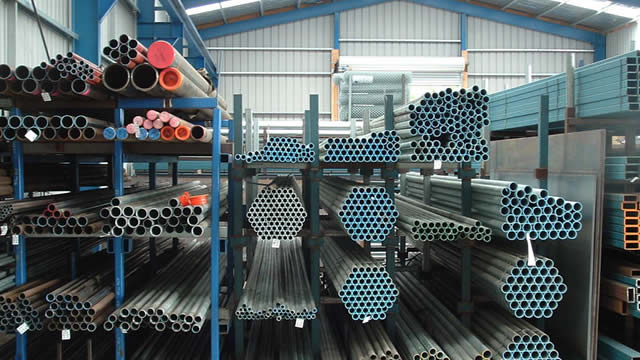
Schnitzer Steel Industries, Inc. recycles ferrous and nonferrous metal, and manufactures finished steel products worldwide. The company acquires, processes, and recycles salvaged vehicles, rail cars, home appliances, industrial machinery, manufacturing scrap, and construction and demolition scrap. It offers recycled ferrous metal, a feedstock used in the production of finished steel products; and nonferrous products, including mixed metal joint products recovered from the shredding process, such as zorba, zurik, aluminum, copper, stainless steel, nickel, brass, titanium, lead, and high temperature alloys. The company also procures salvaged vehicles and sells serviceable used auto parts from these vehicles through its 50 self-service auto parts stores in the United States and Western Canada, as well as sells auto bodies. In addition, it produces various finished steel products using ferrous recycled metal and other raw materials, as well as semi-finished goods, which include billets; and finished goods consisting of rebar, coiled rebar, wire rods, merchant bars, and other specialty products. Further, the company sells catalytic converters to specialty processors that extract the nonferrous precious metals, including platinum, palladium, and rhodium; ferrous and nonferrous recycled metal products to steel mills, foundries, refineries, smelters, wholesalers, and recycled metal processors; and finished steel customers are primarily steel service centers, construction industry subcontractors, steel fabricators, wire drawers, and major farm and wood products suppliers. Schnitzer Steel Industries, Inc. was founded in 1906 and is headquartered in Portland, Oregon.