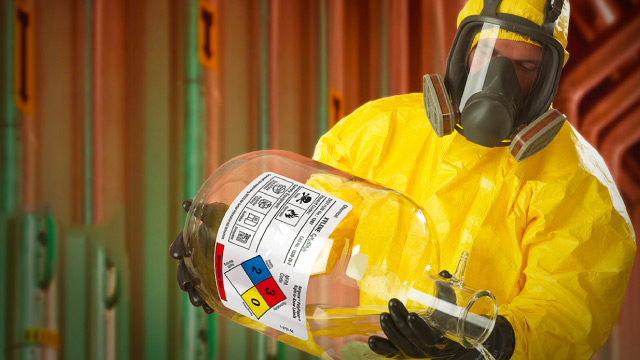
RPM International Inc. manufactures, markets, and sells specialty chemicals for the industrial, specialty, and consumer markets worldwide. It offers waterproofing, coating, and institutional roofing systems; sealants, air barriers, tapes, and foams; residential home weatherization systems; roofing and building maintenance services; sealing and bonding, subfloor preparation, flooring, and glazing solutions; resin flooring systems, polyurethane, MMA waterproof, epoxy floor paint and coatings, concrete repair, and protection products; solutions for fire stopping and intumescent steel coating, and manufacturing industry; rolled asphalt roofing materials and chemical admixtures; concrete and masonry admixtures, concrete fibers, curing and sealing compounds, structural grouts and mortars, epoxy adhesives, injection resins, polyurethane foams, floor hardeners and toppings, joint fillers, industrial and architectural coatings, decorative color/stains/stamps, and restoration materials; insulated building cladding materials; and concrete form wall systems. It also provides polymer flooring systems; fiberglass reinforced plastic gratings and shapes; corrosion-control coating, containment and railcar lining, fire and sound proofing, and heat and cryogenic insulation products; specialty construction products; amine curing agents, reactive diluents, and epoxy resins; fluorescent colorants and pigments; shellac-based-specialty and marine coatings; fire and water damage restoration, carpet cleaning, and disinfecting products; fuel additives; wood treatments, and touch-up products; and nail enamels, polishes, and coating components. In addition, it offers paint contractors and the DIYers solutions, concrete restoration and flooring, metallic and faux finish coatings, cleaners, and hobby paints and cements; and caulk, sealant, adhesive, insulating foam, spackling, glazing, patch, and repair products. The company was incorporated in 1947 and is headquartered in Medina, Ohio.