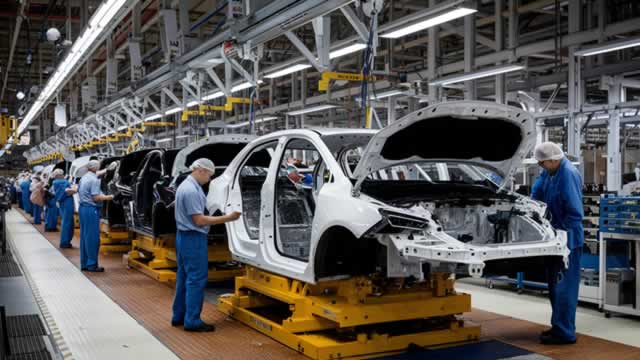
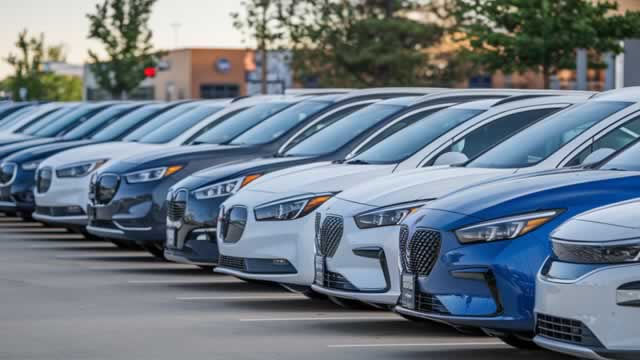
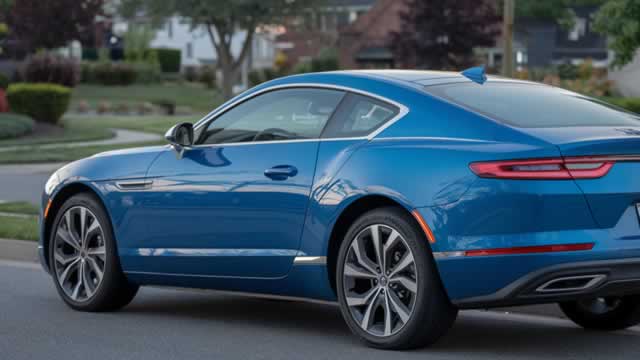
New

Chrome Plugin Live! Redefine the way you read FinTwit 🚀 Install Now

You have successfully sign out
Loading...

Quote Panel

Shape
Updated June 19, 2025
1W % 1M % 3M % 1Y %

Key Metrics

Shape
  • Market Cap


  • Shares Outstanding


  • Share in Float


  • Dividende


  • Earning Date

    No Data


  • Price Target


  • Average Volume


  • Beta


  • Range


  • Industry


  • Website


  • Sector


Fundamentals

Shape

Relative Strength

Shape

RNLSY

Sector

loading...

Top 5 RS in Group

Symbol

Company

RS

5-Day Perf.

Forecast

Shape

$57B

Shape113%

2025-Revenue

$2.37

Shape150%

2025-EPS

$7B

Shape110%

2025-EBITDA

Analyst rating

Strong Sell

Sell

Buy

Neutral

Strong Buy

Shape

Buy

Price Target

NaN(-100.00%)

Number of analyst

Last analyst upgrade/downgrade

Goldman Sachs

upgrade

Previous: Not converted

2024-05-29

Now: Buy

UBS

upgrade

Previous: Not converted

2024-05-24

Now: Neutral

Jefferies

upgrade

Previous: Not converted

2022-06-20

Now: Buy

Zacks Investment Research

downgrade

Previous: Not converted

2022-04-26

Now: Sell

Earnings GrowthShape

status-upYoY

Current

Estimates

Q4.19

arrow
arrow

N/A

-4.33
vs 5.91

Q2.20

arrow
arrow

N/A

-30.28
vs 4.03

Q4.20

arrow
arrow

N/A

-3.02
vs -4.33

Q2.21

arrow
arrow

+105%

1.53
vs -30.28

Q4.21

arrow
arrow

+173%

2.21
vs -3.02

Q2.22

arrow
arrow

N/A

-5.17
vs 1.53

Q4.22

arrow
arrow

+83%

4.04
vs 2.21

Q2.23

arrow
arrow

+260%

8.28
vs -5.17

Q4.23

arrow
arrow

-90%

0.4
vs 4.04

Q2.24

arrow
arrow

-39%

5.02
vs 8.28

Sales GrowthShape

status-upYoY

Current

Estimates

Q4.20

arrow
arrow

-9%

25B  vs 27.5B

Q2.21

arrow
arrow

+27%

23.4B  vs 18.4B

Q4.21

arrow
arrow

-9%

22.9B  vs 25B

Q2.22

arrow
arrow

-10%

21.1B  vs 23.4B

Q4.22

arrow
arrow

+11%

25.3B  vs 22.9B

Q2.23

arrow
arrow

+27%

26.8B  vs 21.1B

Q4.23

arrow
arrow

+1%

25.5B  vs 25.3B

Q2.24

arrow
arrow

+0%

27B  vs 26.8B

Q4.24

arrow
arrow

-39%

15.5B  vs 25.5B

Q1.25

arrow
arrow

NA

10.6B  vs NA

Return on EquityShape

status-upQoQ

Q2.21

arrow
arrow

+1%

0.01
vs -0.03

Q4.21

arrow
arrow

+2%

0.02
vs 0.01

Q2.22

arrow
arrow

-5%

-0.05
vs 0.02

Q4.22

arrow
arrow

+4%

0.04
vs -0.05

Q2.23

arrow
arrow

+7%

0.07
vs 0.04

Q4.23

arrow
arrow

+0%

0
vs 0.07

Q2.24

arrow
arrow

+4%

0.04
vs 0

Q4.24

arrow
arrow

-2%

-0.02
vs 0.04

Institutionnal OwnershipShape

status-upQoQ

Q2.23

arrow
arrow

4

4
vs 4

NA

Q3.23

arrow
arrow

6

6
vs 4

50%

Q4.23

arrow
arrow

5

5
vs 6

-17%

Q1.24

arrow
arrow

5

5
vs 5

NA

Q2.24

arrow
arrow

4

4
vs 5

-20%

Q3.24

arrow
arrow

4

4
vs 4

NA

Q4.24

arrow
arrow

4

4
vs 4

NA

Q1.25

arrow
arrow

6

6
vs 4

50%

Earnings Growth

Latest News

RNLSY

proactiveinvestors.co.uk

3 hours ago