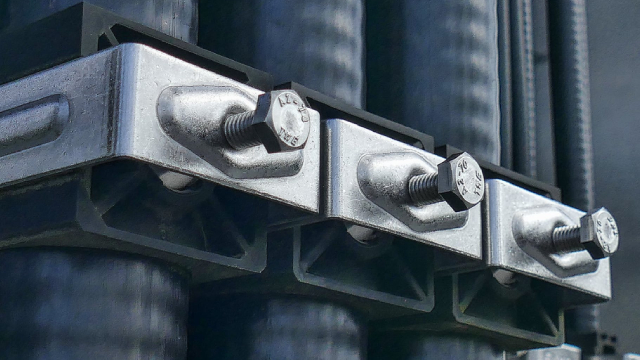
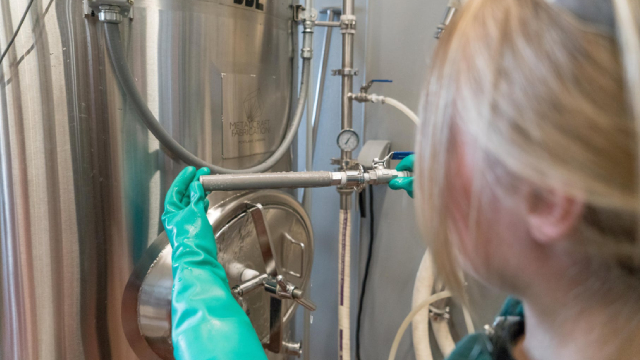
RBC Bearings Incorporated manufactures and markets engineered precision bearings and components in the United States and internationally. It operates through two segments, Aerospace/Defense and Industrial. The company produces plain bearings with self-lubricating or metal-to-metal designs, including rod end bearings, spherical plain bearings, and journal bearings; roller bearings, such as tapered roller bearings, needle roller bearings, and needle bearing track rollers and cam followers, which are anti-friction products that are used in industrial applications and military aircraft platforms; and ball bearings include high precision aerospace, airframe control, thin section, and industrial ball bearings that utilize high precision ball elements to reduce friction in high-speed applications. It also offers mounted bearing products include mounted ball bearings, mounted roller bearings, and mounted plain bearings; and enclosed gearing product lines, including quantis gearmotor, torque arm, tigear, magnagear & maxum, and controlled start transmission. In addition, the company produces power transmission components include mechanical drive components, couplings, and conveyor components; engineered hydraulics and valves for aircraft and submarine applications, and aerospace and defense aftermarket services; fasteners; precision mechanical components, which are used in various general industrial applications; and machine tool collets that are used for holding circulars or rod-like pieces. It serves automotive, tool holding, agricultural and semiconductor machinery, commercial and defense aerospace, ground defense, construction and mining, oil and natural resource extraction, heavy truck, marine, rail and train, packaging, food and beverage, packaging and canning, wind, and general industrial markets through its direct sales force, as well as a network of industrial and aerospace distributors. The company was founded in 1919 and is headquartered in Oxford, Connecticut.