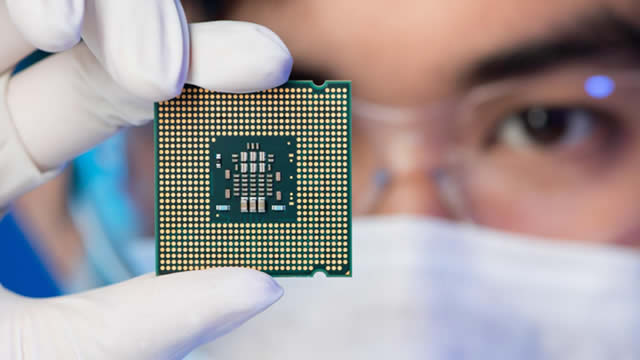
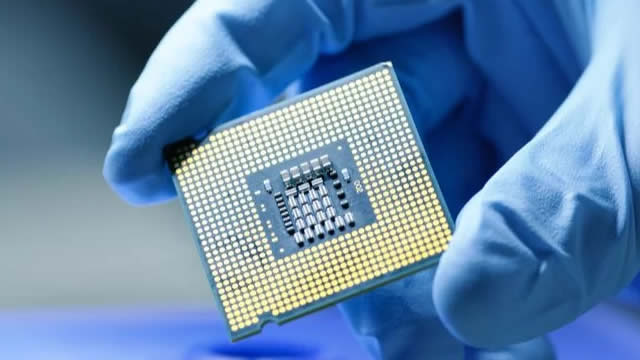
QuickLogic Corporation, a semiconductor company, develops semiconductor platforms and intellectual property solutions for smartphones, wearable, hearable, tablets, and the Internet-of-Things devices. It also provides flexible sensor processing solutions, ultra-low power display bridges, ultra-low power field programmable gate arrays (FPGAs); and analytics toolkit, an end-to-end software suite that offers processes for developing pattern matching sensor algorithms using machine learning technology, as well as programming hardware and design software solutions. The company's products include pASIC 3, QuickRAM, QuickPCI, EOS, QuickAI, SensiML Analytics Studio, ArcticLink III, PolarPro 3, PolarPro II, PolarPro, and Eclipse II, as well as silicon platforms, IP cores, software drivers, firmware, and application software. It delivers its solutions through ultra-low power customer programmable System on Chip (SoC) semiconductor solutions, embedded software, and algorithm solutions for always-on voice and sensor processing, and enhanced visual experiences. In addition, the company licenses FPGA technology for use in other semiconductor companies SoCs. It markets and sells its products to original equipment manufacturers and original design manufacturers through a network of sales managers and distributors in North America, Europe, and the Asia Pacific. QuickLogic Corporation was founded in 1988 and is headquartered in San Jose, California.