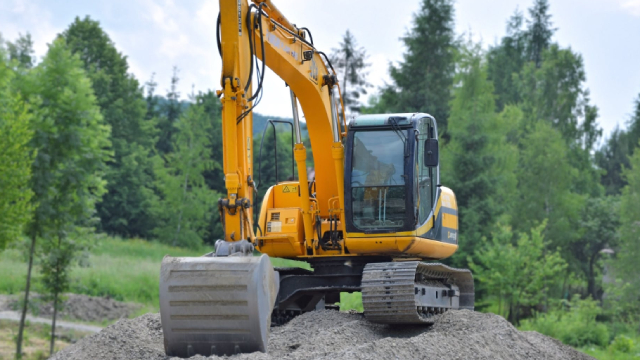
New

Chrome Plugin Live! Redefine the way you read FinTwit 🚀 Install Now

You have successfully sign out
Loading...
Shape
Primoris Services Corporation
PRIM
Shape
US Flag

NASDAQ

7B

Engineering & Construction

Next Earning date - 03 Nov 2025

7B

Engineering & Construction

Next Earning date - 03 Nov 2025

120.44USD

Shape-3.11 ( -2.52%)
Market Closed (as of Sep 16, 20:00 EDT)
favorite-chart

Relative Strenght

92
favorite-chart

Volume Buzz

2%
favorite-chart

Earning Acce

No
favorite-chart

Dist 52w H.

4%

Quote Panel

Shape
Updated September 17, 2025
1W -1.89 % 1M 6.80 % 3M 61.51 % 1Y 112.00 %

Key Metrics

Shape
  • Market Cap

    6.51B


  • Shares Outstanding

    54.01M


  • Share in Float

    53.52M


  • Dividende

    0.3


  • Earning Date

    03 Nov 2025


  • Price Target

    120.44


  • Average Volume

    903843


  • Beta

    1.432


  • Range

    49.1-125.35


  • Industry

    Engineering & Construction


  • Website

    https://www.primoriscorp.com


  • Sector

    Industrials


Fundamentals

Shape

24.04x

P/E Ratio

0.94x

P/S Ratio

4.24x

P/B Ratio

0.7

Debt/Equity

3.5%

Net Margin

$4.4

EPS

How PRIM compares to sector?

P/E Ratio

Relative Strength

Shape

PRIM

Sector

loading...

Top 5 RS in Group

Symbol

Company

RS

5-Day Perf.

Forecast

Shape

$8B

Shape306%

2026-Revenue

$5.58

Shape258%

2026-EPS

$531M

Shape319%

2026-EBITDA

Analyst rating

Strong Sell

Sell

Buy

Neutral

Strong Buy

Shape

Buy

Price Target

117.00(-2.86%)

Number of analyst

3

Last analyst upgrade/downgrade

Jefferies

initialise

Previous: Not converted

2025-03-11

Now: Buy

Guggenheim

initialise

Previous: Not converted

2025-01-08

Now: Buy

Goldman Sachs

upgrade

Previous: Not converted

2023-04-03

Now: Neutral

Earnings GrowthShape

status-upYoY

Current

Estimates

Q3.23

arrow
arrow

+11%

0.89
vs 0.8

Q4.23

arrow
arrow

-10%

0.69
vs 0.77

Q1.24

arrow
arrow

+94%

0.35
vs 0.18

Q2.24

arrow
arrow

+44%

1.04
vs 0.72

Q3.24

arrow
arrow

+37%

1.22
vs 0.89

Q4.24

arrow
arrow

+64%

1.13
vs 0.69

Q1.25

arrow
arrow

+180%

0.98
vs 0.35

Q2.25

arrow
arrow

+62%

1.68
vs 1.04

Q3.25

arrow
arrow

+11%

1.35
vs 1.22

Q4.25

arrow
arrow

-9%

1.03
vs 1.13

Sales GrowthShape

status-upYoY

Current

Estimates

Q3.23

arrow
arrow

+19%

1.5B  vs 1.3B

Q4.23

arrow
arrow

+14%

1.5B  vs 1.3B

Q1.24

arrow
arrow

+12%

1.4B  vs 1.3B

Q2.24

arrow
arrow

+11%

1.6B  vs 1.4B

Q3.24

arrow
arrow

+8%

1.6B  vs 1.5B

Q4.24

arrow
arrow

+15%

1.7B  vs 1.5B

Q1.25

arrow
arrow

+17%

1.6B  vs 1.4B

Q2.25

arrow
arrow

+21%

1.9B  vs 1.6B

Q3.25

arrow
arrow

+11%

1.8B  vs 1.6B

Q4.25

arrow
arrow

0%

1.7B  vs 1.7B

Return on EquityShape

status-upQoQ

Q1.23

arrow
arrow

+0%

0
vs 0.04

Q2.23

arrow
arrow

+3%

0.03
vs 0

Q3.23

arrow
arrow

+4%

0.04
vs 0.03

Q4.23

arrow
arrow

+3%

0.03
vs 0.04

Q1.24

arrow
arrow

+2%

0.02
vs 0.03

Q2.24

arrow
arrow

+4%

0.04
vs 0.02

Q3.24

arrow
arrow

+4%

0.04
vs 0.04

Q4.24

arrow
arrow

+4%

0.04
vs 0.04

Q1.25

arrow
arrow

+3%

0.03
vs 0.04

Q2.25

arrow
arrow

+5%

0.05
vs 0.03

Institutionnal OwnershipShape

status-upQoQ

Q1.23

arrow
arrow

173

173
vs 184

-6%

Q2.23

arrow
arrow

181

181
vs 173

5%

Q3.23

arrow
arrow

198

198
vs 181

9%

Q4.23

arrow
arrow

229

229
vs 198

16%

Q1.24

arrow
arrow

246

246
vs 229

7%

Q2.24

arrow
arrow

305

305
vs 246

24%

Q3.24

arrow
arrow

308

308
vs 305

1%

Q4.24

arrow
arrow

366

366
vs 308

19%

Q1.25

arrow
arrow

371

371
vs 366

1%

Q2.25

arrow
arrow

397

397
vs 371

7%

Earnings Growth

Latest News