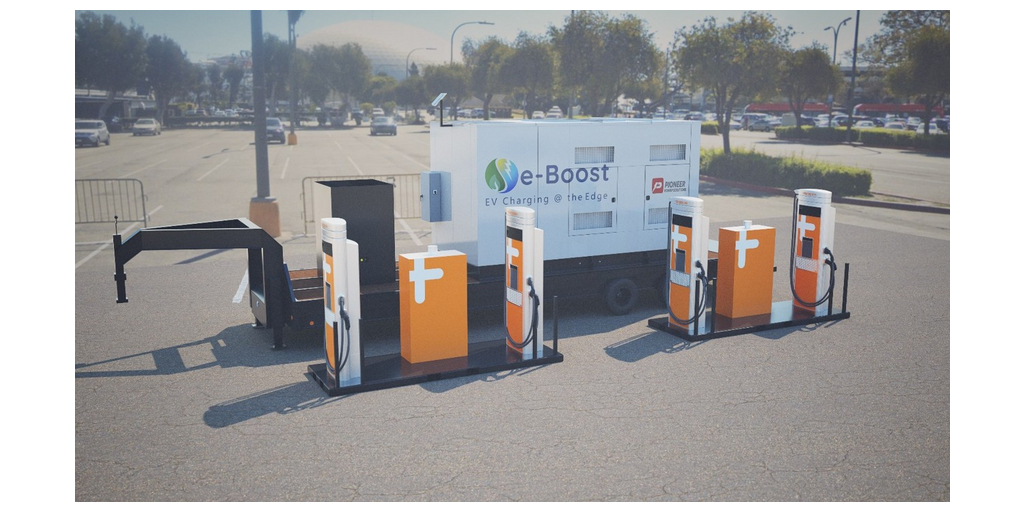
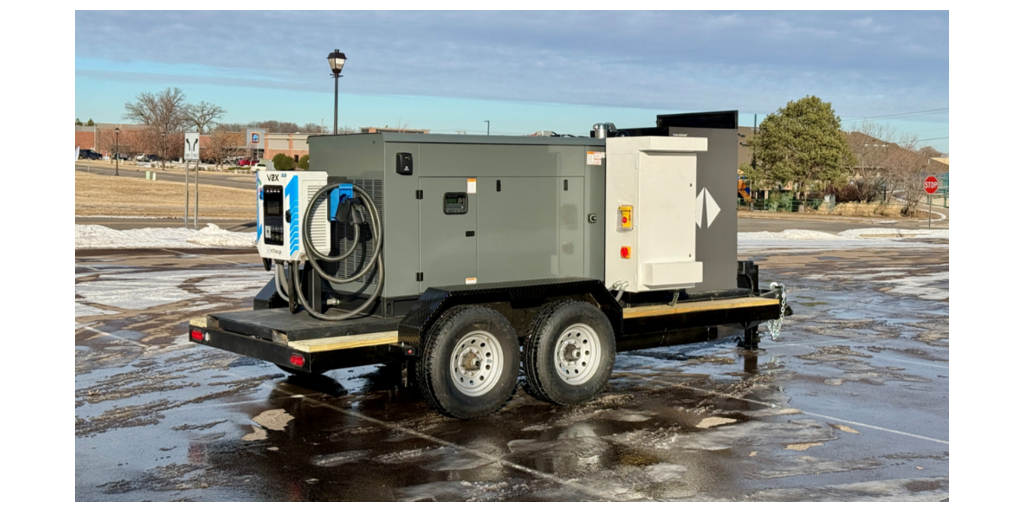
New

Chrome Plugin Live! Redefine the way you read FinTwit 🚀 Install Now

You have successfully sign out
Loading...
Shape
Pioneer Power Solutions, Inc.
PPSI
Shape
US Flag

NASDAQ

Unprofitable

Unprofitable

40M

Electrical Equipment & Parts

Next Earning date - 31 Mar 2025

40M

Electrical Equipment & Parts

Next Earning date - 31 Mar 2025

3.65USD

Shape-0.03 ( -0.68%)
sun-fogPre-market 3.65$arrow-right-up0.01 (0.14%)
Market Closed (as of Feb 07, 21:01 EDT)
favorite-chart

Relative Strenght

19
favorite-chart

Volume Buzz

-66%
favorite-chart

Earning Acce

No
favorite-chart

Dist 52w H.

48%

Quote Panel

Shape
Updated February 11, 2025
1W -3.20 % 1M -8.10 % 3M -20.04 % 1Y -1.09 %

Key Metrics

Shape
  • Market Cap

    39.98M


  • Shares Outstanding

    11.01M


  • Share in Float

    8.49M


  • Dividende

    1.5


  • Earning Date

    31 Mar 2025


  • Price Target

    3.63


  • Average Volume

    114513


  • Beta

    0.652


  • Range

    3.351-7


  • Industry

    Electrical Equipment & Parts


  • Website

    https://www.pioneerpowersolutions.com


  • Sector

    Industrials


Fundamentals

Shape

Relative Strength

Shape

PPSI

Sector

loading...

Top 5 RS in Group

Symbol

Company

RS

5-Day Perf.

Forecast

Shape

Analyst rating

Last analyst upgrade/downgrade

Earnings GrowthShape

status-upYoY

Current

Estimates

Q4.22

arrow
arrow

+163%

0.1
vs -0.16

Q1.23

arrow
arrow

+113%

0.01
vs -0.08

Q2.23

arrow
arrow

N/A

-0.03
vs -0.26

Q3.23

arrow
arrow

+177%

0.1
vs -0.13

Q4.23

arrow
arrow

N/A

-0.07
vs 0.1

Q1.24

arrow
arrow

N/A

-0.07
vs 0.01

Q2.24

arrow
arrow

N/A

-0.27
vs -0.03

Q3.24

arrow
arrow

N/A

-0.21
vs 0.1

Q4.24

arrow
arrow

N/A

-0.36
vs -0.07

Q1.25

arrow
arrow

+157%

0.04
vs -0.07

Sales GrowthShape

status-upYoY

Current

Estimates

Q4.22

arrow
arrow

+172%

9.5M  vs 3.5M

Q1.23

arrow
arrow

+41%

8.5M  vs 6M

Q2.23

arrow
arrow

+183%

12.1M  vs 4.3M

Q3.23

arrow
arrow

+99%

12.4M  vs 6.3M

Q4.23

arrow
arrow

-12%

8.4M  vs 9.5M

Q1.24

arrow
arrow

+1%

8.6M  vs 8.5M

Q2.24

arrow
arrow

-48%

6.3M  vs 12.1M

Q3.24

arrow
arrow

-12%

10.9M  vs 12.4M

Q4.24

arrow
arrow

+2%

8.6M  vs 8.4M

Q1.25

arrow
arrow

+11%

9.5M  vs 8.6M

Return on EquityShape

status-upQoQ

Q4.22

arrow
arrow

+6%

0.06
vs -0.08

Q1.23

arrow
arrow

+1%

0.01
vs 0.06

Q2.23

arrow
arrow

-2%

-0.02
vs 0.01

Q3.23

arrow
arrow

+6%

0.06
vs -0.02

Q4.23

arrow
arrow

-19%

-0.19
vs 0.06

Q1.24

arrow
arrow

-6%

-0.06
vs -0.19

Q2.24

arrow
arrow

-14%

-0.14
vs -0.06

Q3.24

arrow
arrow

-8%

-0.08
vs -0.14

Institutionnal OwnershipShape

status-upQoQ

Q4.22

arrow
arrow

17

17
vs 16

6%

Q1.23

arrow
arrow

17

17
vs 17

NA

Q2.23

arrow
arrow

26

26
vs 17

53%

Q3.23

arrow
arrow

32

32
vs 26

23%

Q4.23

arrow
arrow

32

32
vs 32

NA

Q1.24

arrow
arrow

35

35
vs 32

9%

Q2.24

arrow
arrow

25

25
vs 35

-29%

Q3.24

arrow
arrow

32

32
vs 25

28%

Earnings Growth

Latest News