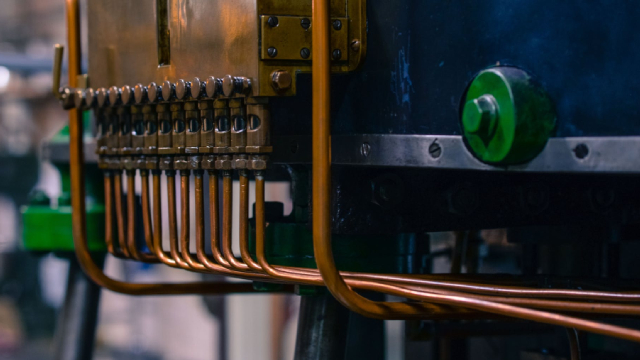
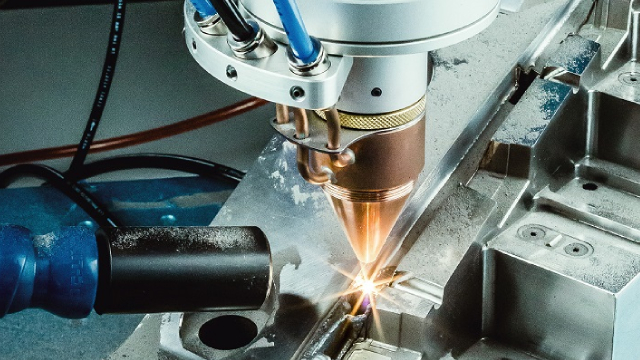
New

Chrome Plugin Live! Redefine the way you read FinTwit 🚀 Install Now

You have successfully sign out
Loading...
Shape
Omega Flex, Inc.
OFLX
Shape
US Flag

NASDAQ

412M

Industrial - Machinery

Next Earning date - 04 Mar 2025

412M

Industrial - Machinery

Next Earning date - 04 Mar 2025

40.77USD
0.00 ( 0.00%)
favorite-chart

Relative Strenght

12
favorite-chart

Volume Buzz

-60%
favorite-chart

Earning Acce

Yes
favorite-chart

Dist 52w H.

47%

Quote Panel

Shape
Updated January 21, 2025
1W 0.49 % 1M -3.09 % 3M -16.28 % 1Y -44.30 %

Key Metrics

Shape
  • Market Cap

    411.55M


  • Shares Outstanding

    10.09M


  • Share in Float

    3.52M


  • Dividende

    1.35


  • Earning Date

    04 Mar 2025


  • Price Target

    40.77


  • Average Volume

    18368


  • Beta

    0.388


  • Range

    37.27-76.5


  • Industry

    Industrial - Machinery


  • Website

    https://www.omegaflexcorp.com


  • Sector

    Industrials


Fundamentals

Shape

Relative Strength

Shape

OFLX

Sector

loading...

Top 5 RS in Group

Symbol

Company

RS

5-Day Perf.

Forecast

Shape

No Data Available

Analyst rating

Strong Sell

Sell

Buy

Neutral

Strong Buy

Shape

Price Target

NaN(-100.00%)

Number of analyst

Last analyst upgrade/downgrade

No Data Available

Earnings GrowthShape

status-upYoY

Current

Estimates

Q2.22

arrow
arrow

-11%

0.54
vs 0.61

Q3.22

arrow
arrow

+7%

0.65
vs 0.61

Q4.22

arrow
arrow

-19%

0.61
vs 0.75

Q1.23

arrow
arrow

+6%

0.57
vs 0.54

Q2.23

arrow
arrow

-17%

0.45
vs 0.54

Q3.23

arrow
arrow

-15%

0.55
vs 0.65

Q4.23

arrow
arrow

-21%

0.48
vs 0.61

Q1.24

arrow
arrow

-26%

0.42
vs 0.57

Q2.24

arrow
arrow

N/A

0.45
vs 0.45

Q3.24

arrow
arrow

-16%

0.46
vs 0.55

Sales GrowthShape

status-upYoY

Current

Estimates

Q2.22

arrow
arrow

-1%

31.7M  vs 32M

Q3.22

arrow
arrow

0%

31.6M  vs 31.7M

Q4.22

arrow
arrow

-13%

30.8M  vs 35.5M

Q1.23

arrow
arrow

-4%

30M  vs 31.3M

Q2.23

arrow
arrow

-19%

25.8M  vs 31.7M

Q3.23

arrow
arrow

-13%

27.5M  vs 31.6M

Q4.23

arrow
arrow

-9%

28.1M  vs 30.8M

Q1.24

arrow
arrow

-16%

25.2M  vs 30M

Q2.24

arrow
arrow

-5%

24.6M  vs 25.8M

Q3.24

arrow
arrow

-10%

24.9M  vs 27.5M

Return on EquityShape

status-upQoQ

Q4.22

arrow
arrow

+9%

0.09
vs 0.1

Q1.23

arrow
arrow

+8%

0.08
vs 0.09

Q2.23

arrow
arrow

+6%

0.06
vs 0.08

Q3.23

arrow
arrow

+7%

0.07
vs 0.06

Q4.23

arrow
arrow

+6%

0.06
vs 0.07

Q1.24

arrow
arrow

+5%

0.05
vs 0.06

Q2.24

arrow
arrow

+6%

0.06
vs 0.05

Q3.24

arrow
arrow

+6%

0.06
vs 0.06

Institutionnal OwnershipShape

status-upQoQ

Q4.22

arrow
arrow

80

80
vs 79

1%

Q1.23

arrow
arrow

85

85
vs 80

6%

Q2.23

arrow
arrow

90

90
vs 85

6%

Q3.23

arrow
arrow

93

93
vs 90

3%

Q4.23

arrow
arrow

92

92
vs 93

-1%

Q1.24

arrow
arrow

92

92
vs 92

NA

Q2.24

arrow
arrow

95

95
vs 92

3%

Q3.24

arrow
arrow

94

94
vs 95

-1%

Earnings Growth

Latest News