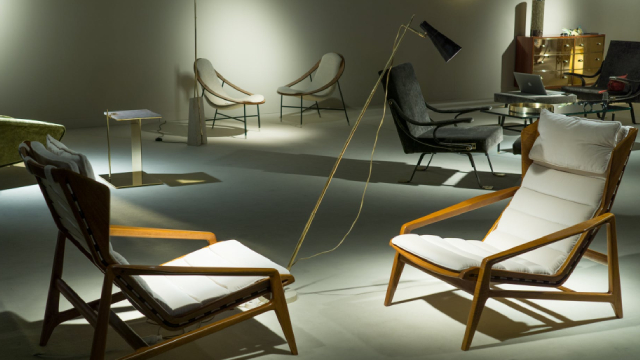
New

Chrome Plugin Live! Redefine the way you read FinTwit 🚀 Install Now

You have successfully sign out
Loading...
Shape
Nova LifeStyle, Inc.
NVFY
Shape
US Flag

NASDAQ

Unprofitable

EPS improving

Unprofitable

EPS improving

4M

Furnishings, Fixtures & Appliances

0.62USD
Shape-0.02 ( -2.82%)
favorite-chart

Relative Strenght

2
favorite-chart

Volume Buzz

-88%
favorite-chart

Earning Acce

Yes
favorite-chart

Dist 52w H.

86%

Quote Panel

Shape
Updated January 12, 2025
1W -8.82 % 1M 50.85 % 3M -54.41 % 1Y -78.47 %

Key Metrics

Shape
  • Market Cap

    4.47M


  • Shares Outstanding

    7.21M


  • Share in Float

    5.42M


  • Dividende

    0


  • Earning Date

    No Data


  • Price Target

    0.62


  • Average Volume

    80003


  • Beta

    1.261


  • Range

    0.39-4.42


  • Industry

    Furnishings, Fixtures & Appliances


  • Website

    https://novalifestyle.com


  • Sector

    Consumer Cyclical


Fundamentals

Shape

Relative Strength

Shape

NVFY

Sector

loading...

Top 5 RS in Group

Symbol

Company

RS

5-Day Perf.

Forecast

Shape

No Data Available

Analyst rating

Strong Sell

Sell

Buy

Neutral

Strong Buy

Shape

Price Target

NaN(-100.00%)

Number of analyst

Last analyst upgrade/downgrade

No Data Available

Earnings GrowthShape

status-upYoY

Current

Estimates

Q2.22

arrow
arrow

N/A

-4.15
vs -0.70

Q3.22

arrow
arrow

N/A

-1.25
vs -1.10

Q4.22

arrow
arrow

N/A

-6.31
vs -1.88

Q1.23

arrow
arrow

N/A

-0.85
vs -0.65

Q2.23

arrow
arrow

N/A

-0.37
vs -4.15

Q3.23

arrow
arrow

N/A

-0.83
vs -1.25

Q4.23

arrow
arrow

N/A

-2.44
vs -6.31

Q1.24

arrow
arrow

N/A

-0.65
vs -0.85

Q2.24

arrow
arrow

N/A

-0.22
vs -0.37

Q3.24

arrow
arrow

+100%

NA
vs -0.83

Sales GrowthShape

status-upYoY

Current

Estimates

Q2.22

arrow
arrow

+7%

3.8M  vs 3.6M

Q3.22

arrow
arrow

+3%

3M  vs 2.9M

Q4.22

arrow
arrow

-25%

2.2M  vs 3M

Q1.23

arrow
arrow

-49%

1.9M  vs 3.7M

Q2.23

arrow
arrow

+17%

4.5M  vs 3.8M

Q3.23

arrow
arrow

-18%

2.5M  vs 3M

Q4.23

arrow
arrow

+1%

2.3M  vs 2.2M

Q1.24

arrow
arrow

+27%

2.4M  vs 1.9M

Q2.24

arrow
arrow

-40%

2.7M  vs 4.5M

Q3.24

arrow
arrow

+6%

2.6M  vs 2.5M

Return on EquityShape

status-upQoQ

Q4.22

arrow
arrow

-133%

-1.33
vs -0.12

Q1.23

arrow
arrow

-23%

-0.23
vs -1.33

Q2.23

arrow
arrow

-11%

-0.11
vs -0.23

Q3.23

arrow
arrow

-33%

-0.33
vs -0.11

Q4.23

arrow
arrow

-942%

-9.42
vs -0.33

Q1.24

arrow
arrow

+3422%

34.22
vs -9.42

Q2.24

arrow
arrow

-1169%

-11.69
vs 34.22

Q3.24

arrow
arrow

+275%

2.75
vs -11.69

Institutionnal OwnershipShape

status-upQoQ

Q2.21

arrow
arrow

6

6
vs 7

-14%

Q3.21

arrow
arrow

9

9
vs 6

50%

Q4.21

arrow
arrow

6

6
vs 9

-33%

Q1.22

arrow
arrow

6

6
vs 6

NA

Q2.22

arrow
arrow

8

8
vs 6

33%

Q3.22

arrow
arrow

8

8
vs 8

NA

Q4.22

arrow
arrow

10

10
vs 8

25%

Q1.23

arrow
arrow

8

8
vs 10

-20%

Earnings Growth

Latest News