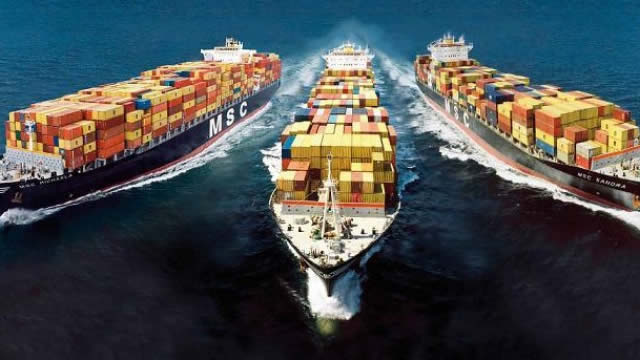
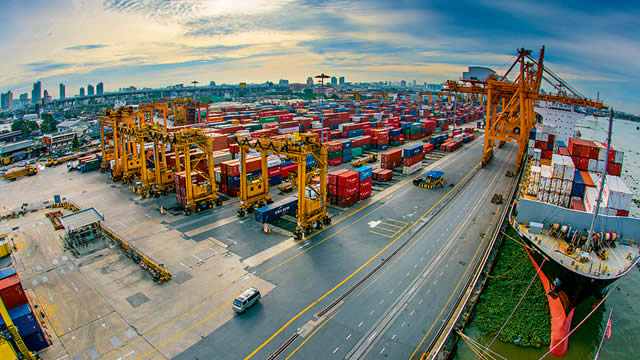
Matson, Inc., together with its subsidiaries, provides ocean transportation and logistics services. The company's Ocean Transportation segment offers ocean freight transportation services to the domestic non-contiguous economies of Hawaii, Alaska, and Guam, as well as to other island economies in Micronesia. It primarily transports dry containers of mixed commodities, refrigerated commodities, packaged foods and beverages, building materials, automobiles, and household goods; livestock; seafood; general sustenance cargo; and garments, footwear, e-commerce, and other retail merchandise. This segment also operates an expedited service from China to Long Beach, California, and various islands in the South Pacific, as well as Okinawa, Japan; and provides container stevedoring, refrigerated cargo services, inland transportation, container equipment maintenance, and other terminal services to ocean carriers on the Hawaiian islands of Oahu, Hawaii, Maui, and Kauai, as well as in the Alaska locations of Anchorage, Kodiak, and Dutch Harbor. In addition, the company offers vessel management and container transshipment services. Its Logistics segment provides multimodal transportation brokerage services, including domestic and international rail intermodal, long-haul and regional highway trucking, specialized hauling, flat-bed and project, less-than-truckload, and expedited freight services; less-than-container load consolidation and freight forwarding services; warehousing and distribution services; supply chain management services, and non-vessel operating common carrier freight forwarding services. The company serves the U.S. military, freight forwarders, retailers, consumer goods, automobile manufacturers, and other customers. The company was formerly known as Alexander & Baldwin Holdings, Inc. and changed its name to Matson, Inc. in June 2012. Matson, Inc. was founded in 1882 and is headquartered in Honolulu, Hawaii.