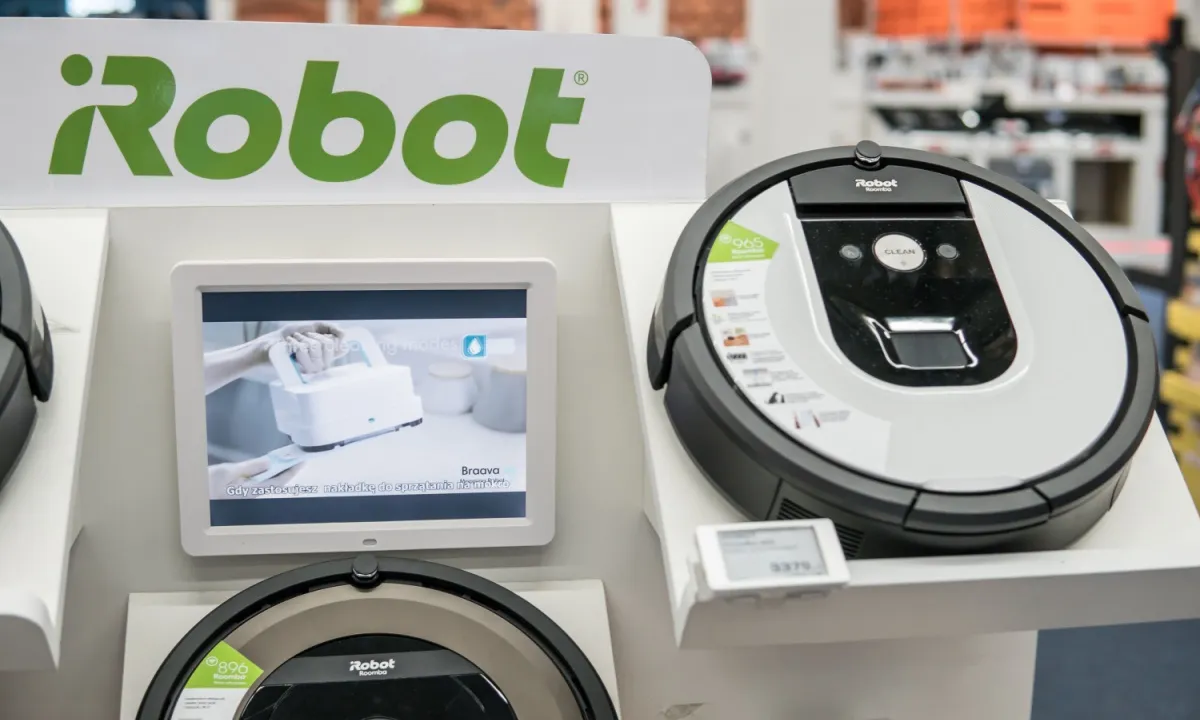
New

Chrome Plugin Live! Redefine the way you read FinTwit 🚀 Install Now

You have successfully sign out
Loading...
Shape
iRobot Corporation
IRBT
Shape
US Flag

NASDAQ

Unprofitable

EPS improving

Unprofitable

EPS improving

319M

Furnishings, Fixtures & Appliances

Next Earning date - 24 Feb 2025

319M

Furnishings, Fixtures & Appliances

Next Earning date - 24 Feb 2025

8.36USD
Shape-2.10 ( -20.05%)
favorite-chart

Relative Strenght

63
favorite-chart

Volume Buzz

23%
favorite-chart

Earning Acce

No
favorite-chart

Dist 52w H.

74%

Quote Panel

Shape
Updated January 13, 2025
1W -14.48 % 1M 17.15 % 3M 23.82 % 1Y -65.41 %

Key Metrics

Shape
  • Market Cap

    319.34M


  • Shares Outstanding

    30.56M


  • Share in Float

    28.61M


  • Dividende

    0


  • Earning Date

    24 Feb 2025


  • Price Target

    10.45


  • Average Volume

    1.35M


  • Beta

    1.188


  • Range

    5.83-32.0


  • Industry

    Furnishings, Fixtures & Appliances


  • Website

    https://www.irobot.com


  • Sector

    Consumer Cyclical


Fundamentals

Shape

Relative Strength

Shape

IRBT

Sector

loading...

Top 5 RS in Group

Symbol

Company

RS

5-Day Perf.

Forecast

Shape

Analyst rating

Last analyst upgrade/downgrade

Earnings GrowthShape

status-upYoY

Current

Estimates

Q4.22

arrow
arrow

N/A

-1.52
vs 1.67

Q2.23

arrow
arrow

N/A

-1.67
vs -0.66

Q3.23

arrow
arrow

N/A

-1.42
vs -0.35

Q3.23

arrow
arrow

N/A

-2.82
vs -0.35

Q4.23

arrow
arrow

N/A

-1.82
vs -1.52

Q1.24

arrow
arrow

N/A

-1.53
vs NA

Q2.24

arrow
arrow

N/A

-1.96
vs -1.67

Q3.24

arrow
arrow

+101%

0.03
vs -2.82

Q4.24

arrow
arrow

N/A

-1.45
vs -1.82

Q1.25

arrow
arrow

N/A

-0.73
vs -1.53

Sales GrowthShape

status-upYoY

Current

Estimates

Q4.22

arrow
arrow

-19%

357.9M  vs 440.7M

Q2.23

arrow
arrow

-45%

160.3M  vs 292M

Q3.23

arrow
arrow

-7%

236.6M  vs 255.4M

Q3.23

arrow
arrow

-27%

186.2M  vs 255.4M

Q4.23

arrow
arrow

-17%

297.4M  vs 357.9M

Q1.24

arrow
arrow

NA

145.1M  vs NA

Q2.24

arrow
arrow

+2%

162.9M  vs 160.3M

Q3.24

arrow
arrow

+4%

193.4M  vs 186.2M

Q4.24

arrow
arrow

-37%

187.8M  vs 297.4M

Q1.25

arrow
arrow

-8%

134M  vs 145.1M

Return on EquityShape

status-upQoQ

Q4.22

arrow
arrow

-18%

-0.18
vs -0.23

Q2.23

arrow
arrow

-21%

-0.21
vs -0.18

Q3.23

arrow
arrow

-25%

-0.25
vs -0.21

Q3.23

arrow
arrow

-31%

-0.31
vs -0.25

Q4.23

arrow
arrow

-32%

-0.32
vs -0.31

Q1.24

arrow
arrow

+4%

0.04
vs -0.32

Q2.24

arrow
arrow

-47%

-0.47
vs 0.04

Q3.24

arrow
arrow

-4%

-0.04
vs -0.47

Institutionnal OwnershipShape

status-upQoQ

Q4.22

arrow
arrow

265

265
vs 253

5%

Q1.23

arrow
arrow

238

238
vs 265

-10%

Q2.23

arrow
arrow

245

245
vs 238

3%

Q3.23

arrow
arrow

246

246
vs 245

0%

Q4.23

arrow
arrow

254

254
vs 246

3%

Q1.24

arrow
arrow

201

201
vs 254

-21%

Q2.24

arrow
arrow

192

192
vs 201

-4%

Q3.24

arrow
arrow

188

188
vs 192

-2%

Earnings Growth

Latest News