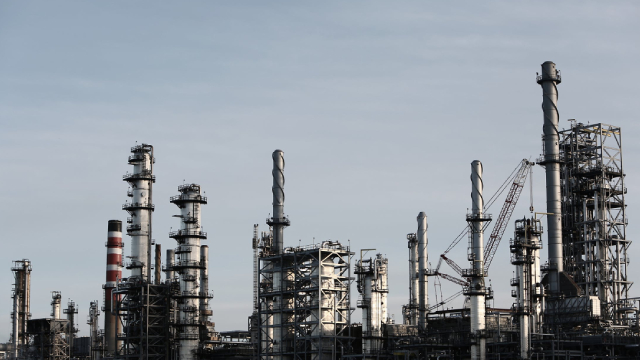
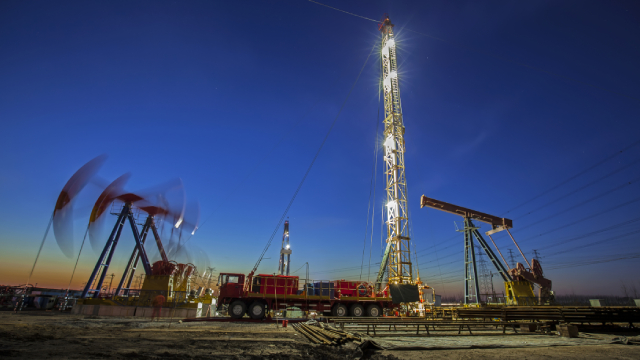
Imperial Oil Limited engages in exploration, production, and sale of crude oil and natural gas in Canada. The company operates through three segments: Upstream, Downstream and Chemical segments. The Upstream segment explores for, and produces crude oil, natural gas, synthetic oil, and bitumen. As of December 31, 2021, this segment had 386 million oil-equivalent barrels of proved undeveloped reserves. The Downstream segment is involved in the transportation and refining of crude oil, blending of refined products and the distribution, and marketing of refined products. It also transports crude oil to refineries by contracted pipelines, common carrier pipelines, and rail; maintains a distribution system to move petroleum products to market by pipeline, tanker, rail, and road transport; and owns and operates fuel terminals, natural gas liquids, and products pipelines in Alberta, Manitoba, and Ontario. In addition, this segment markets and supplies petroleum products to motoring public through approximately 2,400 Esso and Mobil-branded sites. Further, it sells petroleum products, including fuel, asphalt, and lubricants for industrial and transportation customers, independent marketers, and resellers, as well as other refiners serving the agriculture, residential heating, and commercial markets through branded fuel and lubricant resellers. The Chemical segment manufactures and markets various petrochemicals, benzene, aromatic and aliphatic solvents, plasticizer intermediates, and polyethylene resin. Imperial Oil Limited has a strategic agreement with E3 Metals Corp. to advance a lithium-extraction pilot in Alberta. The company was incorporated in 1880 and is headquartered in Calgary, Canada. Imperial Oil Limited is a subsidiary of Exxon Mobil Corporation.