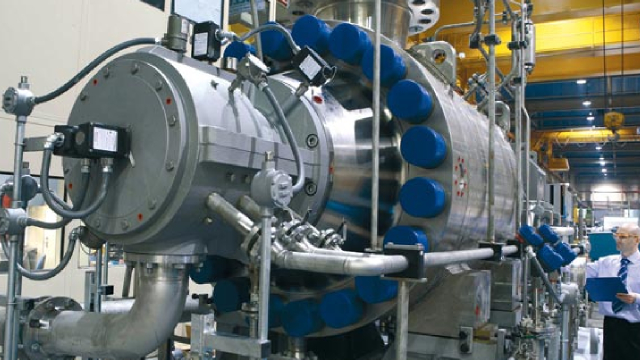
IDEX Corporation, together with its subsidiaries, provides applied solutions worldwide. The company operates through three segments: Fluid & Metering Technologies (FMT), Health & Science Technologies (HST), and Fire & Safety/Diversified Products (FSDP). The FMT segment designs, produces, and distributes positive displacement pumps, small volume provers, flow meters, injectors, and other fluid-handling pump modules and systems, as well as offers flow monitoring and other services for the food, chemical, general industrial, water and wastewater, agricultural, and energy industries. The HST segment designs, produces, and distributes precision fluidics, rotary lobe pumps, centrifugal and positive displacement pumps, roll compaction and drying systems, pneumatic components and sealing solutions, high performance molded and extruded sealing components, custom mechanical and shaft seals, engineered hygienic mixers and valves, biocompatible medical devices and implantables, air compressors and blowers, optical components and coatings, laboratory and commercial equipment, precision photonic solutions, and precision gear and peristaltic pump technologies. This segment serves food and beverage, pharmaceutical and biopharmaceutical, cosmetics, marine, chemical, wastewater and water treatment, life sciences, research, and defense markets. The FSDP segment designs, produces, and distributes firefighting pumps, valves and controls, rescue tools, lifting bags, and other components and systems for the fire and rescue industry; engineered stainless steel banding and clamping devices for various industrial and commercial applications; and precision equipment for dispensing, metering, and mixing colorants and paints used in retail and commercial businesses. IDEX Corporation was incorporated in 1987 and is headquartered in Northbrook, Illinois.