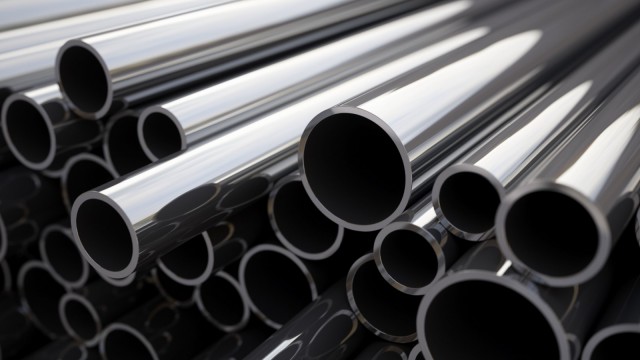
New

Chrome Plugin Live! Redefine the way you read FinTwit 🚀 Install Now

You have successfully sign out
Loading...
Shape
Huadi International Group Co., Ltd.
HUDI
Shape
US Flag

NASDAQ

24M

Steel

Next Earning date - 04 Feb 2025

24M

Steel

Next Earning date - 04 Feb 2025

1.65USD
Shape-0.02 ( -1.20%)
favorite-chart

Relative Strenght

10
favorite-chart

Volume Buzz

-74%
favorite-chart

Earning Acce

No
favorite-chart

Dist 52w H.

61%

Quote Panel

Shape
Updated January 24, 2025
1W -2.94 % 1M -7.30 % 3M -17.91 % 1Y -38.66 %

Key Metrics

Shape
  • Market Cap

    23.53M


  • Shares Outstanding

    14.26M


  • Share in Float

    4.26M


  • Dividende

    0


  • Earning Date

    04 Feb 2025


  • Price Target

    1.65


  • Average Volume

    17968


  • Beta

    2.364


  • Range

    1.55-4.25


  • Industry

    Steel


  • Website

    https://www.huadi.cc


  • Sector

    Basic Materials


Fundamentals

Shape

Relative Strength

Shape

HUDI

Sector

loading...

Top 5 RS in Group

Symbol

Company

RS

5-Day Perf.

Forecast

Shape

No Data Available

Analyst rating

Strong Sell

Sell

Buy

Neutral

Strong Buy

Shape

Price Target

NaN(-100.00%)

Number of analyst

Last analyst upgrade/downgrade

No Data Available

Earnings GrowthShape

status-upYoY

Current

Estimates

Q2.22

arrow
arrow

N/A

0.07
vs NA

Q3.22

arrow
arrow

N/A

0.15
vs NA

Q4.22

arrow
arrow

N/A

0.05
vs NA

Q1.23

arrow
arrow

N/A

0.1
vs NA

Q2.23

arrow
arrow

+75%

0.13
vs 0.07

Q3.23

arrow
arrow

N/A

NA
vs 0.15

Q4.23

arrow
arrow

N/A

NA
vs 0.05

Q1.24

arrow
arrow

N/A

NA
vs 0.1

Q3.24

arrow
arrow

N/A

1.34
vs NA

Q4.24

arrow
arrow

N/A

1.54
vs NA

Sales GrowthShape

status-upYoY

Current

Estimates

Q2.22

arrow
arrow

-2%

19.8M  vs 20.2M

Q3.22

arrow
arrow

-51%

19.8M  vs 40.4M

Q4.22

arrow
arrow

+3%

19M  vs 18.4M

Q1.23

arrow
arrow

+3%

38M  vs 36.8M

Q2.23

arrow
arrow

+17%

23.2M  vs 19.8M

Q3.23

arrow
arrow

+134%

46.4M  vs 19.8M

Q4.23

arrow
arrow

-2%

18.5M  vs 19M

Q1.24

arrow
arrow

-51%

18.5M  vs 38M

Q3.24

arrow
arrow

-59%

18.9M  vs 46.4M

Q4.24

arrow
arrow

+3%

19.2M  vs 18.5M

Return on EquityShape

status-upQoQ

Q2.22

arrow
arrow

+2%

0.02
vs -0.00

Q3.22

arrow
arrow

+2%

0.02
vs 0.02

Q4.22

arrow
arrow

+1%

0.01
vs 0.02

Q1.23

arrow
arrow

+2%

0.02
vs 0.01

Q2.23

arrow
arrow

+1%

0.01
vs 0.02

Q3.23

arrow
arrow

+2%

0.02
vs 0.01

Q4.23

arrow
arrow

+1%

0.01
vs 0.02

Q1.24

arrow
arrow

+1%

0.01
vs 0.01

Institutionnal OwnershipShape

status-upQoQ

Q4.22

arrow
arrow

10

10
vs 5

100%

Q1.23

arrow
arrow

13

13
vs 10

30%

Q2.23

arrow
arrow

6

6
vs 13

-54%

Q3.23

arrow
arrow

6

6
vs 6

NA

Q4.23

arrow
arrow

5

5
vs 6

-17%

Q1.24

arrow
arrow

6

6
vs 5

20%

Q2.24

arrow
arrow

5

5
vs 6

-17%

Q3.24

arrow
arrow

4

4
vs 5

-20%

Earnings Growth

Latest News