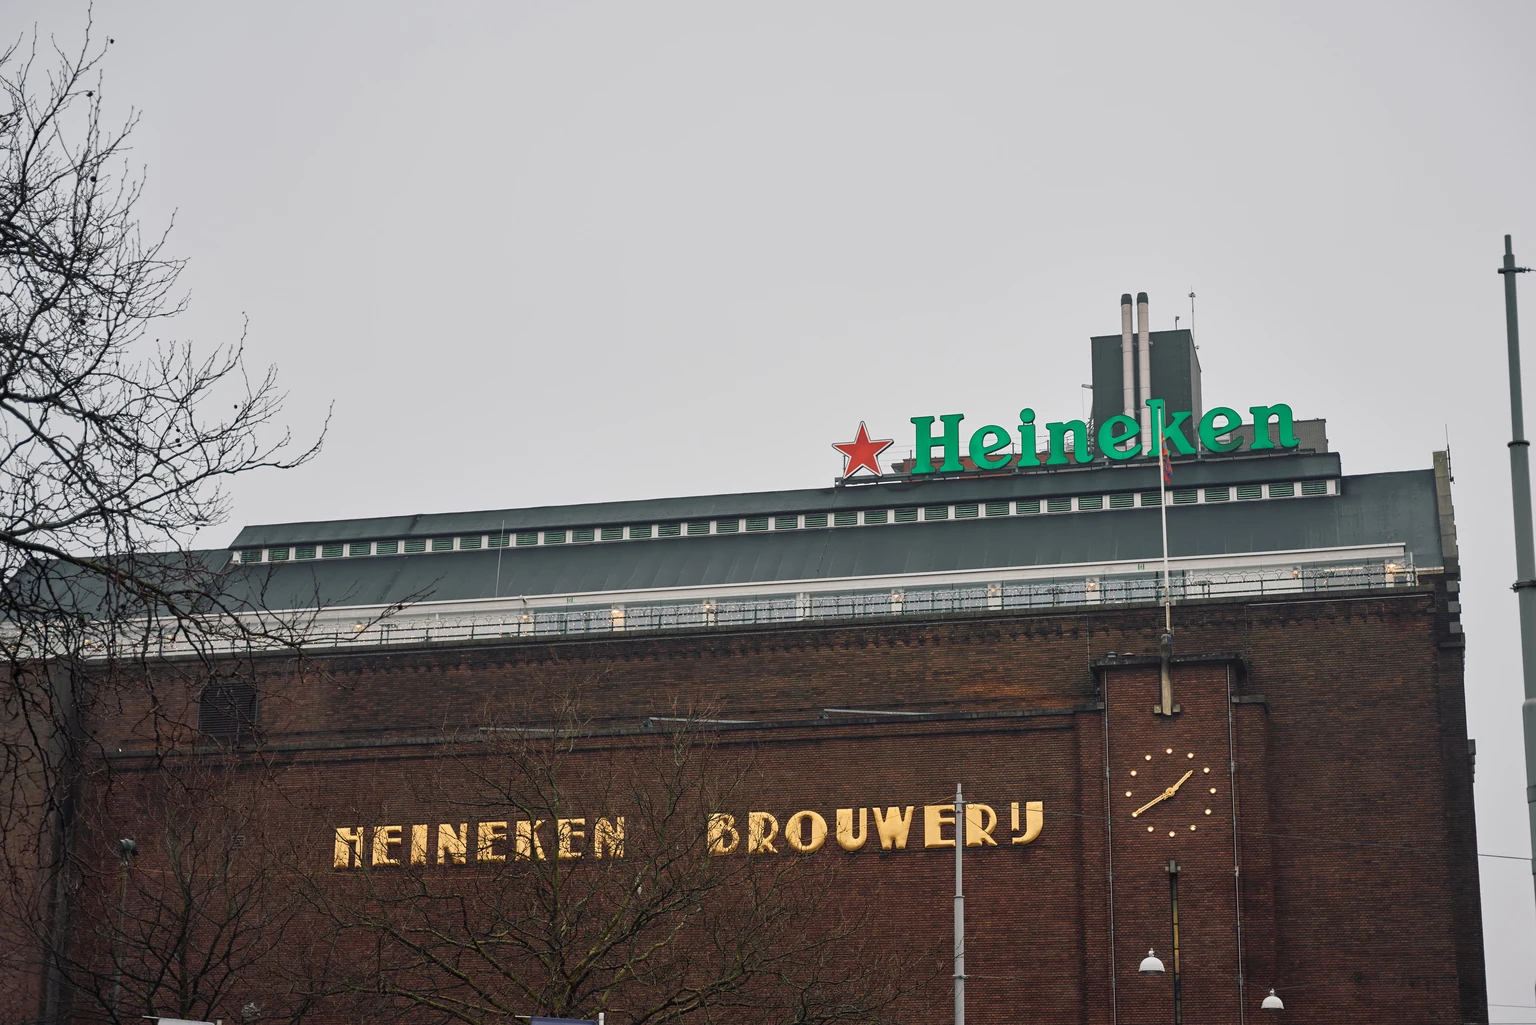
New

Chrome Plugin Live! Redefine the way you read FinTwit 🚀 Install Now

You have successfully sign out
Loading...
Shape
Heineken N.V.
HEINY
Shape
US Flag

OTC

EPS improving

EPS improving

43B

Beverages - Alcoholic

Next Earning date - N/A

38.58USD

Shape-0.40 ( -1.03%)
Market Open
favorite-chart

Relative Strenght

favorite-chart

Volume Buzz

-99%
favorite-chart

Earning Acce

No
favorite-chart

Dist 52w H.

17%

Quote Panel

Shape
Updated September 19, 2025
1W -1.05 % 1M -6.47 % 3M -9.48 % 1Y -11.11 %

Key Metrics

Shape
  • Market Cap

    43.15B


  • Shares Outstanding

    1.12B


  • Share in Float

    1.08B


  • Dividende

    0.434


  • Earning Date

    No Data


  • Price Target

    38.58


  • Average Volume

    149939


  • Beta

    0.58


  • Range

    32.77-46.62


  • Industry

    Beverages - Alcoholic


  • Website

    https://www.theheinekencompany.com


  • Sector

    Consumer Defensive


Fundamentals

Shape

Relative Strength

Shape

HEINY

Sector

loading...

Top 5 RS in Group

Symbol

Company

RS

5-Day Perf.

Forecast

Shape

$34B

Shape128%

2025-Revenue

$2.80

Shape189%

2025-EPS

$7B

Shape102%

2025-EBITDA

Analyst rating

Strong Sell

Sell

Buy

Neutral

Strong Buy

Shape

Buy

Price Target

N/A(N/A)

Number of analyst

N/A

Last analyst upgrade/downgrade

Exane BNP Paribas

upgrade

Previous: Not converted

2022-09-05

Now: Outperform

Zacks Investment Research

upgrade

Previous: Not converted

2022-04-25

Now: Hold

Earnings GrowthShape

status-upYoY

Current

Estimates

Q3.22

arrow
arrow

N/A

NA
vs NA

Q4.22

arrow
arrow

-41%

2.65
vs 4.51

Q1.23

arrow
arrow

N/A

NA
vs NA

Q2.23

arrow
arrow

-3%

2.22
vs 2.3

Q3.23

arrow
arrow

N/A

NA
vs NA

Q4.23

arrow
arrow

-16%

2.23
vs 2.65

Q1.24

arrow
arrow

N/A

NA
vs NA

Q2.24

arrow
arrow

N/A

-0.18
vs 2.22

Q3.24

arrow
arrow

N/A

NA
vs NA

Q4.24

arrow
arrow

-11%

1.98
vs 2.23

Sales GrowthShape

status-upYoY

Current

Estimates

Q1.23

arrow
arrow

NA

NA  vs NA

Q2.23

arrow
arrow

+8%

14.5B  vs 13.5B

Q3.23

arrow
arrow

NA

NA  vs NA

Q4.23

arrow
arrow

+4%

15.8B  vs 15.2B

Q1.24

arrow
arrow

NA

NA  vs NA

Q2.24

arrow
arrow

+2%

14.8B  vs 14.5B

Q3.24

arrow
arrow

NA

NA  vs NA

Q4.24

arrow
arrow

-5%

15B  vs 15.8B

Q1.25

arrow
arrow

NA

5.9B  vs NA

Q2.25

arrow
arrow

-56%

6.5B  vs 14.8B

Return on EquityShape

status-upQoQ

Q1.23

arrow
arrow

NA

NA
vs NA

Q2.23

arrow
arrow

+6%

0.06
vs 0.07

Q3.23

arrow
arrow

NA

NA
vs NA

Q4.23

arrow
arrow

+6%

0.06
vs 0.06

Q1.24

arrow
arrow

NA

NA
vs NA

Q2.24

arrow
arrow

0%

-0.00
vs 0.06

Q3.24

arrow
arrow

NA

NA
vs NA

Q4.24

arrow
arrow

+5%

0.05
vs -0.00

Q1.25

arrow
arrow

NA

NA
vs NA

Q2.25

arrow
arrow

+2%

0.02
vs 0.05

Institutionnal OwnershipShape

status-upQoQ

Q1.23

arrow
arrow

20

20
vs 16

25%

Q2.23

arrow
arrow

23

23
vs 20

15%

Q3.23

arrow
arrow

22

22
vs 23

-4%

Q4.23

arrow
arrow

22

22
vs 22

NA

Q1.24

arrow
arrow

19

19
vs 22

-14%

Q2.24

arrow
arrow

18

18
vs 19

-5%

Q3.24

arrow
arrow

15

15
vs 18

-17%

Q4.24

arrow
arrow

14

14
vs 15

-7%

Q1.25

arrow
arrow

12

12
vs 14

-14%

Q2.25

arrow
arrow

17

17
vs 12

42%

Earnings Growth

Latest News