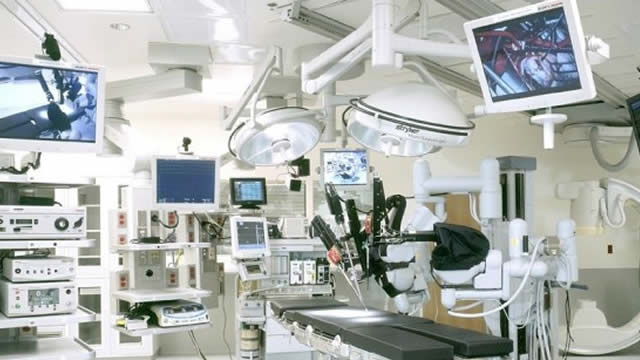
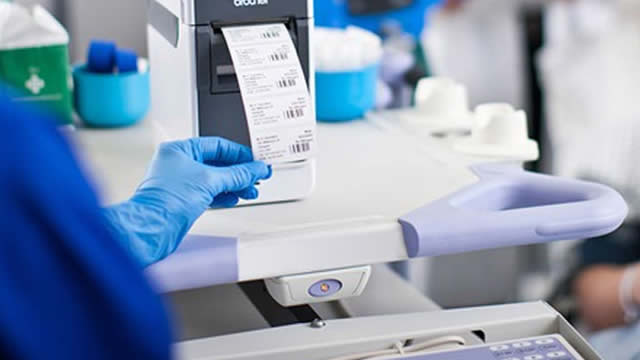
Haemonetics Corporation, a healthcare company, provides medical products and solutions. It operates through three segments: Plasma, Blood Center, and Hospital. The company offers automated plasma collection devices, related disposables, and software, including NexSys PCS and PCS2 plasmapheresis equipment and related disposables and intravenous solutions, as well as integrated information technology platforms for plasma customers to manage their donors, operations, and supply chain; and NexLynk DMS donor management system. It also provides automated blood component and manual whole blood collection systems, such as MCS brand apheresis equipment to collect specific blood components from the donor; disposable whole blood collection and component storage sets; SafeTrace Tx blood bank information system; and BloodTrack blood management software, a suite of blood management and bedside transfusion solutions that combines software with hardware components, as well as an extension of the hospital's blood bank information system. In addition, the company offers hospital products comprising TEG, ClotPro, and HAS hemostasis analyzer systems that provide a comprehensive assessment of a patient's overall hemostasis; TEG Manager software, which connects various TEG analyzers throughout the hospital, providing clinicians remote access to active and historical test results that inform treatment decisions; and Cell Saver Elite +, an autologous blood recovery system for cardiovascular, orthopedic, trauma, transplant, vascular, obstetrical, and gynecological surgeries. It markets and sells its products through direct sales force, independent distributors, and sales representatives. Haemonetics Corporation was founded in 1971 and is headquartered in Boston, Massachusetts.