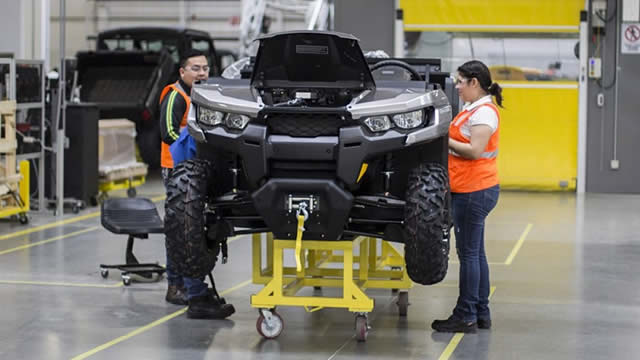
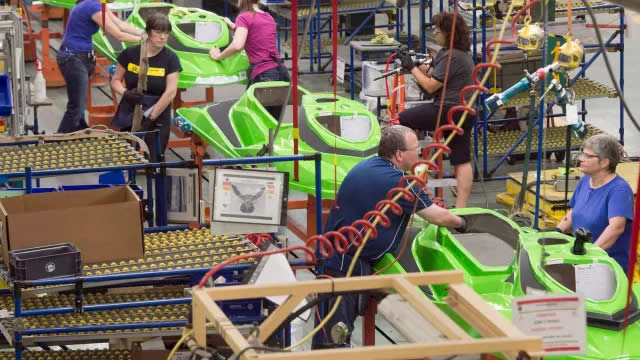
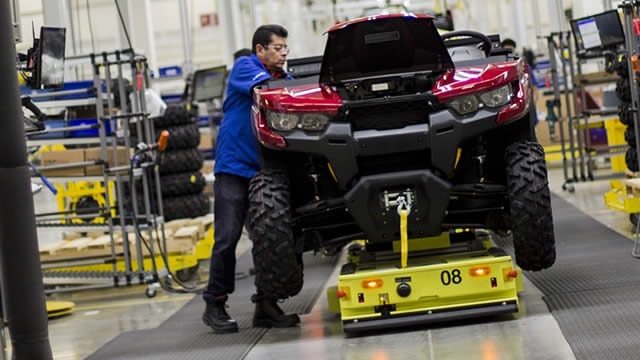
New

Chrome Plugin Live! Redefine the way you read FinTwit 🚀 Install Now

You have successfully sign out
Loading...
Shape
Fox Factory Holding Corp.
FOXF
Shape
US Flag

NASDAQ

1B

Auto - Parts

Next Earning date - 27 Feb 2025

1B

Auto - Parts

Next Earning date - 27 Feb 2025

25.99USD

Shape0.19 ( 0.74%)
Market Closed (as of Feb 10, 21:00 EDT)
favorite-chart

Relative Strenght

9
favorite-chart

Volume Buzz

-27%
favorite-chart

Earning Acce

No
favorite-chart

Dist 52w H.

63%

Quote Panel

Shape
Updated February 11, 2025
1W % 1M % 3M % 1Y %

Key Metrics

Shape
  • Market Cap


  • Shares Outstanding


  • Share in Float


  • Dividende


  • Earning Date

    No Data


  • Price Target


  • Average Volume


  • Beta


  • Range


  • Industry


  • Website


  • Sector


Fundamentals

Shape

Relative Strength

Shape

FOXF

Sector

loading...

Top 5 RS in Group

Symbol

Company

RS

5-Day Perf.

Forecast

Shape

$1B

Shape295%

2025-Revenue

$1.96

Shape1684%

2025-EPS

$232M

Shape480%

2025-EBITDA

Analyst rating

Strong Sell

Sell

Buy

Neutral

Strong Buy

Shape

Buy

Price Target

0.00(-100.00%)

Number of analyst

0

Last analyst upgrade/downgrade

No Data Available

Earnings GrowthShape

status-upYoY

Current

Estimates

Q4.22

arrow
arrow

+35%

1.43
vs 1.06

Q1.23

arrow
arrow

N/A

1.2
vs NA

Q2.23

arrow
arrow

-8%

1.21
vs 1.32

Q3.23

arrow
arrow

-22%

1.06
vs 1.36

Q4.23

arrow
arrow

-66%

0.48
vs 1.43

Q1.24

arrow
arrow

-76%

0.29
vs 1.2

Q2.24

arrow
arrow

-69%

0.38
vs 1.21

Q3.24

arrow
arrow

-67%

0.35
vs 1.06

Q4.24

arrow
arrow

-41%

0.29
vs 0.48

Q1.25

arrow
arrow

+11%

0.32
vs 0.29

Sales GrowthShape

status-upYoY

Current

Estimates

Q4.22

arrow
arrow

+19%

408.6M  vs 342.3M

Q1.23

arrow
arrow

NA

399.9M  vs NA

Q2.23

arrow
arrow

+6%

400.7M  vs 378M

Q3.23

arrow
arrow

-19%

331.1M  vs 409.2M

Q4.23

arrow
arrow

-19%

332.5M  vs 408.6M

Q1.24

arrow
arrow

-17%

333.5M  vs 399.9M

Q2.24

arrow
arrow

-13%

348.5M  vs 400.7M

Q3.24

arrow
arrow

+8%

359.1M  vs 331.1M

Q4.24

arrow
arrow

-3%

321.3M  vs 332.5M

Q1.25

arrow
arrow

+1%

335.3M  vs 333.5M

Return on EquityShape

status-upQoQ

Q4.22

arrow
arrow

+5%

0.05
vs 0.05

Q1.23

arrow
arrow

+4%

0.04
vs 0.05

Q2.23

arrow
arrow

+3%

0.03
vs 0.04

Q3.23

arrow
arrow

+3%

0.03
vs 0.03

Q4.23

arrow
arrow

+0%

0
vs 0.03

Q1.24

arrow
arrow

0%

-0.00
vs 0

Q2.24

arrow
arrow

+0%

0
vs -0.00

Q3.24

arrow
arrow

+0%

0
vs 0

Institutionnal OwnershipShape

status-upQoQ

Q4.22

arrow
arrow

316

316
vs 283

12%

Q1.23

arrow
arrow

334

334
vs 316

6%

Q2.23

arrow
arrow

309

309
vs 334

-7%

Q3.23

arrow
arrow

318

318
vs 309

3%

Q4.23

arrow
arrow

313

313
vs 318

-2%

Q1.24

arrow
arrow

301

301
vs 313

-4%

Q2.24

arrow
arrow

283

283
vs 301

-6%

Q3.24

arrow
arrow

271

271
vs 283

-4%

Earnings Growth

Latest News