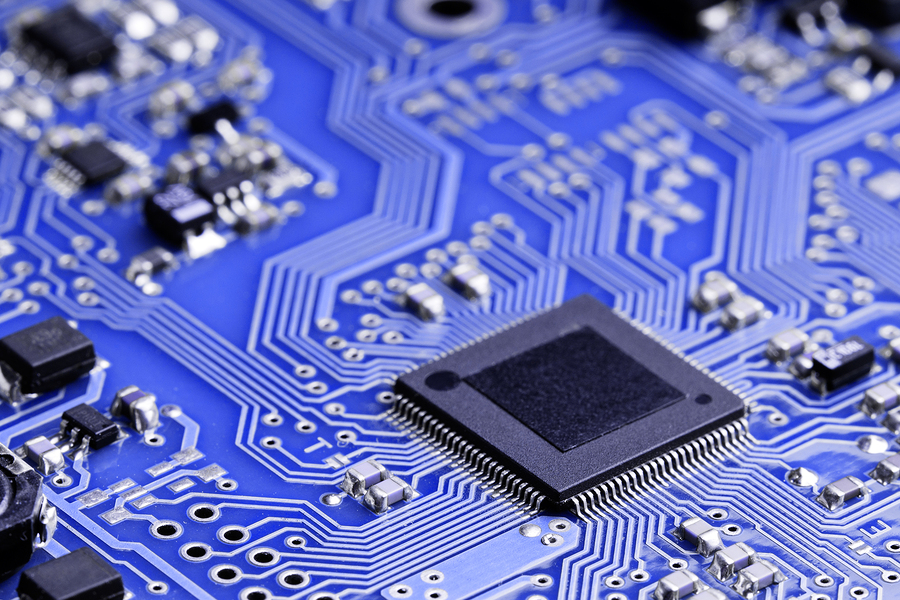
DuPont de Nemours, Inc. provides technology-based materials and solutions in the United States, Canada, the Asia Pacific, Latin America, Europe, the Middle East, and Africa. It operates through three segments: Electronics & Industrial, Mobility & Materials, and Water & Protection. The Electronics & Industrial segment supplies materials and printing systems to the advanced printing industry; and materials and solutions for the fabrication of semiconductors and integrated circuits addressing front-end and back-end of the manufacturing process. This segment also provides semiconductor and advanced packaging materials; dielectric and metallization solutions for chip packaging; and silicones for light emitting diode packaging and semiconductor applications; permanent and process chemistries for the fabrication of printed circuit boards to include laminates and substrates, electroless, and electrolytic metallization solutions, as well as patterning solutions, and materials and metallization processes for metal finishing, decorative, and industrial applications. In addition, it offers various materials to manufacture rigid and flexible displays for organic light emitting diode, and other display applications, as well as provides high performance parts, and specialty silicone elastomers, and lubricants. The Mobility & Materials segment provides engineering resins, silicone encapsulants, pastes, filaments, and advanced films to engineers and designers in the transportation, electronics, renewable energy, industrial, and consumer end-markets. The Water & Protection segment provides engineered products and integrated systems for worker safety, water purification and separation, transportation, energy, medical packaging and building materials. The company was formerly known as DowDuPont Inc. and changed its name to DuPont de Nemours, Inc. in June 2019. DuPont de Nemours, Inc. is headquartered in Wilmington, Delaware.