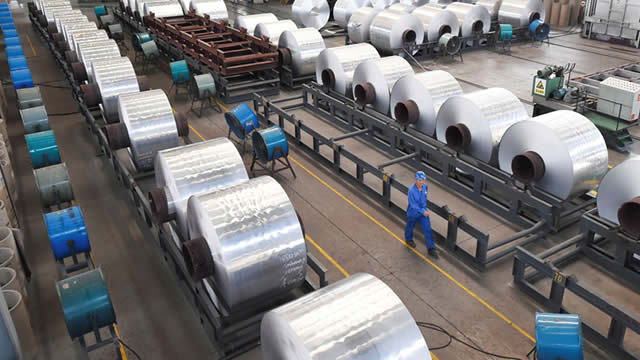
Constellium SE, together with its subsidiaries, engages in the design, manufacture, and sale of specialty rolled and extruded aluminum products for the packaging, aerospace, and automotive end-markets. The company operates through three segments: Packaging & Automotive Rolled Products, Aerospace & Transportation, and Automotive Structures & Industry. The Packaging & Automotive Rolled Products segment produces rolled aluminum products, including can stock and closure stock for the beverage and food industry, as well as foil stock for the flexible packaging market. It also supplies automotive body sheets and heat exchangers for the automotive market; and specialty reflective sheets. The Aerospace & Transportation segment provides rolled aluminum products, including aerospace plates, sheets, and extrusions; and aerospace wing skins, as well as plates and sheets for use in transportation, industry, and defense applications. The Automotive Structures & Industry segment offers extruded products and technologically advanced structures for the automotive industry, including crash-management systems, body structures, side impact beams, and battery enclosures; and hard and soft alloy extruded profiles for various industry applications in the automotive, engineering, rail, and other transportation end markets. This segment also provides downstream technology and services, which include pre-machining, surface treatment, research and development, and technical support services. The company sells its products directly or through distributors in France, Germany, the Czech Republic, the United Kingdom, Switzerland, and the United States, as well as Shanghai, and Seoul. Constellium SE was incorporated in 2010 and is headquartered in Paris, France.