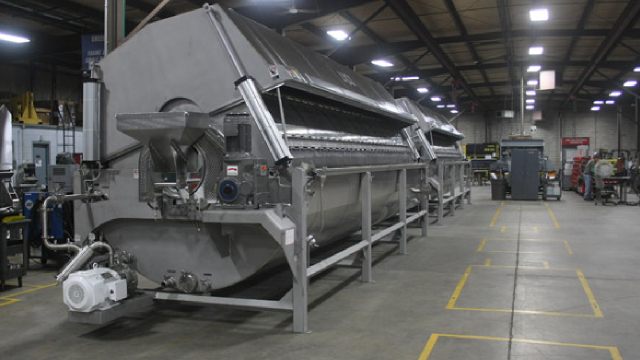
Crawford United Corporation, together with its subsidiaries, provides specialty industrial products and solutions in the United States, Puerto Rico, Mexico, Canada, and internationally. It operates through two segments, Commercial Air Handling Equipment, and Industrial and Transportation Products. The Commercial Air Handling segment designs, manufactures, and installs large-scale commercial, institutional, and industrial custom air handling solutions to health care, education, pharmaceutical, and industrial manufacturing markets under the FactoryBilt and SiteBilt brand names. The Industrial and Transportation Products segment is involved in the manufacture of flexible interlocking metal hoses primarily to heavy-duty truck manufacturers and aftermarket suppliers, as well as to the agricultural, industrial, and petrochemical markets; and distribution of silicone and hydraulic hoses to the agriculture and general industrial markets. The company also provides engineering, machining, grinding, welding, brazing, heat treat, and assembly solutions; rubber and plastic marine hose for the recreational boating industry; engineered manufacturing solutions, including CNC machining, anodizing, electro polishing, and laser marking for defense, aerospace, and medical device markets; and hydraulic hoses, air tank assemblies, and related products to manufacturers of firefighting trucks and other emergency vehicles. In addition, it engages in the supply of highly engineered forgings for the aerospace, industrial gas turbine, medical prosthetics, alternative energy, petrochemical, and defense industries; and developing and commercializing marketing and data analytic technology applications. The company was formerly known as Hickok Incorporated and changed its name to Crawford United Corporation in May 2019. Crawford United Corporation was founded in 1910 and is headquartered in Cleveland, Ohio.