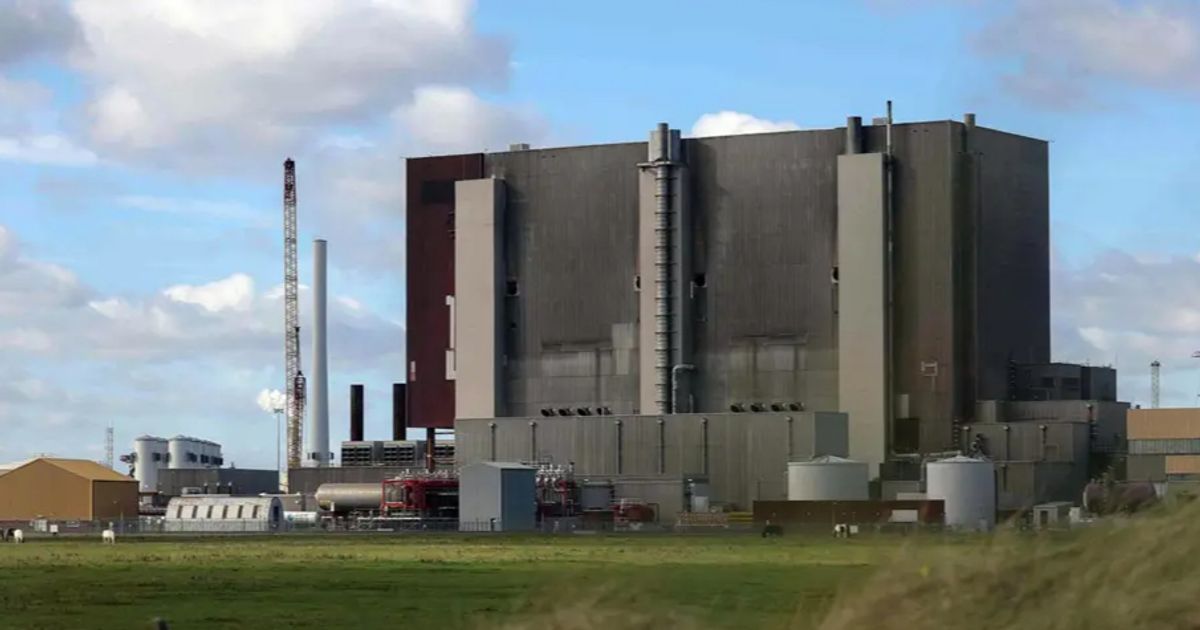
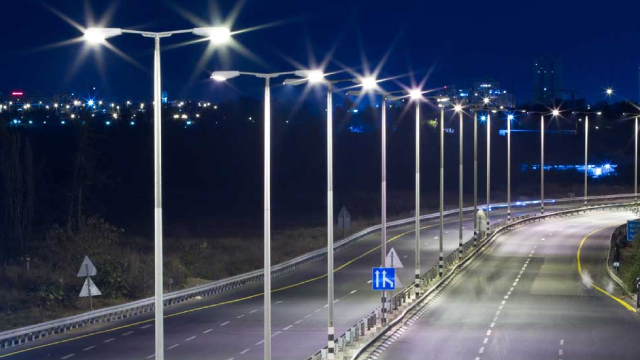
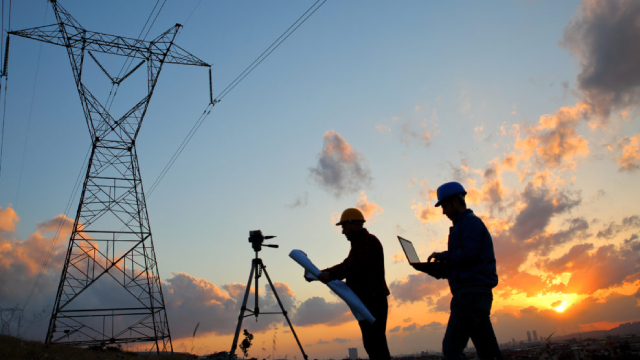
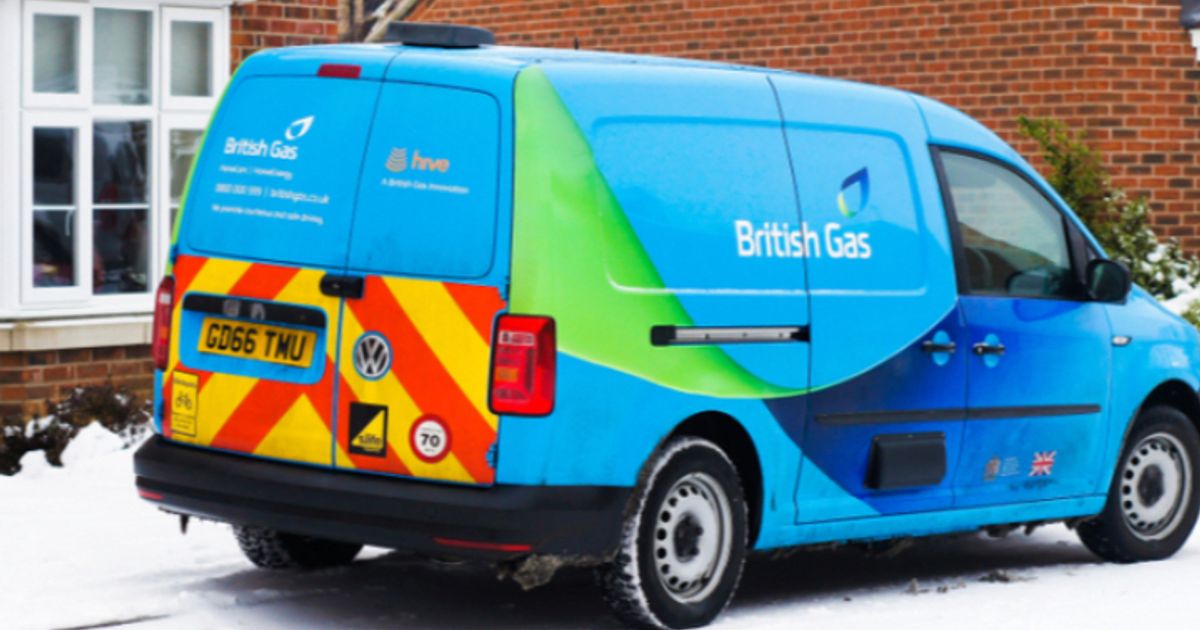
Centrica plc operates as an integrated energy company in the United Kingdom, Ireland, Norway, North America, and internationally. The company operates through British Gas Services & Solutions, British Gas Energy, Centrica Business Solutions, Bord Gáis Energy, Energy Marketing & Trading, and Upstream segments. It supplies gas and electricity to residential customers, as well as offers energy-related services; and generates power from nuclear assets. The company also provides installation, repair, and maintenance services for domestic central heating, plumbing and drains, home electrical, and gas and kitchen appliances; and heating, ventilation, and air conditioning equipment, as well as offers breakdown services. In addition, it is involved in the procurement, trading, and optimization of energy; procurement and sale of LNG; and supplies energy efficiency solutions and technologies to residential customers. Further, the company produces and processes gas and oil; develops new fields to maintain reserves; constructs, owns, and exploits infrastructure; and engages in the social enterprise investment fund activities. Additionally, it provides vehicle leasing, commercial, and insurance services, as well as energy management products and services; and operates a gas storage and franchise network. The company was formerly known as Yieldtop plc and changed its name to Centrica plc in December 1996. Centrica plc was founded in 1812 and is based in Windsor, the United Kingdom.