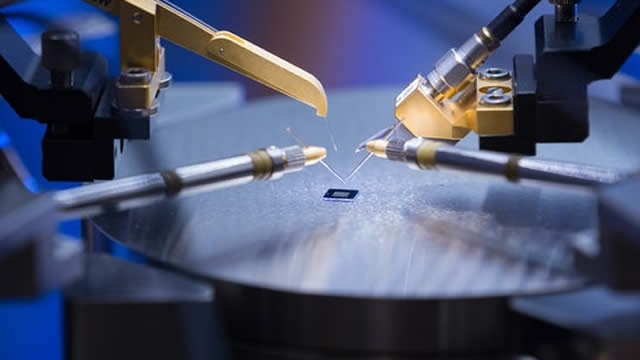
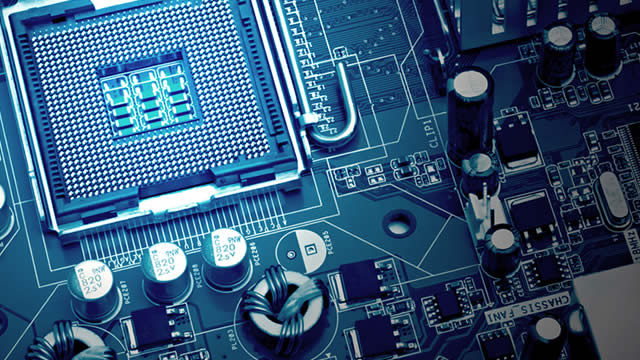
New

Chrome Plugin Live! Redefine the way you read FinTwit 🚀 Install Now

You have successfully sign out
Loading...
Shape
Cohu, Inc.
COHU
Shape
US Flag

NASDAQ

1B

Semiconductors

Next Earning date - 20 Feb 2025

1B

Semiconductors

Next Earning date - 20 Feb 2025

24.07USD
Shape-0.40 ( -1.63%)
favorite-chart

Relative Strenght

19
favorite-chart

Volume Buzz

-79%
favorite-chart

Earning Acce

No
favorite-chart

Dist 52w H.

34%

Quote Panel

Shape
Updated January 24, 2025
1W -3.22 % 1M -12.31 % 3M -7.03 % 1Y -29.74 %

Key Metrics

Shape
  • Market Cap

    1.12B


  • Shares Outstanding

    46.61M


  • Share in Float

    45.39M


  • Dividende

    0


  • Earning Date

    20 Feb 2025


  • Price Target

    24.07


  • Average Volume

    322315


  • Beta

    1.521


  • Range

    22.8-36.6


  • Industry

    Semiconductors


  • Website

    https://www.cohu.com


  • Sector

    Technology


Fundamentals

Shape

Relative Strength

Shape

COHU

Sector

loading...

Top 5 RS in Group

Symbol

Company

RS

5-Day Perf.

Forecast

Shape

$493M

Shape417%

2025-Revenue

$0.76

Shape294%

2025-EPS

$70M

Shape4505%

2025-EBITDA

Analyst rating

Strong Sell

Sell

Buy

Neutral

Strong Buy

Shape

Buy

Price Target

30.00(24.64%)

Number of analyst

1

Last analyst upgrade/downgrade

Needham

downgrade

Previous: Buy

2025-01-13

Now: Hold

Citigroup

downgrade

Previous: Not converted

2024-07-15

Now: Neutral

B. Riley Securities

upgrade

Previous: Not converted

2023-07-17

Now: Buy

Zacks Investment Research

downgrade

Previous: Not converted

2022-04-26

Now: Sell

Earnings GrowthShape

status-upYoY

Current

Estimates

Q4.22

arrow
arrow

-3%

0.7
vs 0.72

Q2.23

arrow
arrow

-31%

0.56
vs 0.81

Q3.23

arrow
arrow

-35%

0.48
vs 0.74

Q3.23

arrow
arrow

-53%

0.35
vs 0.74

Q4.23

arrow
arrow

-67%

0.23
vs 0.7

Q1.24

arrow
arrow

N/A

0.01
vs NA

Q2.24

arrow
arrow

N/A

-0.01
vs 0.56

Q3.24

arrow
arrow

N/A

-0.08
vs 0.35

Q4.24

arrow
arrow

N/A

-0.11
vs 0.23

Q1.25

arrow
arrow

-17%

0.01
vs 0.01

Sales GrowthShape

status-upYoY

Current

Estimates

Q4.22

arrow
arrow

0%

191.1M  vs 191.9M

Q2.23

arrow
arrow

-17%

179.4M  vs 217.2M

Q3.23

arrow
arrow

-18%

168.9M  vs 206.7M

Q3.23

arrow
arrow

-27%

150.8M  vs 206.7M

Q4.23

arrow
arrow

-28%

137.2M  vs 191.1M

Q1.24

arrow
arrow

NA

107.6M  vs NA

Q2.24

arrow
arrow

-42%

104.7M  vs 179.4M

Q3.24

arrow
arrow

-37%

95.3M  vs 150.8M

Q4.24

arrow
arrow

-31%

95.1M  vs 137.2M

Q1.25

arrow
arrow

-4%

103.6M  vs 107.6M

Return on EquityShape

status-upQoQ

Q4.22

arrow
arrow

+2%

0.02
vs 0.03

Q2.23

arrow
arrow

+2%

0.02
vs 0.02

Q3.23

arrow
arrow

+1%

0.01
vs 0.02

Q3.23

arrow
arrow

+0%

0
vs 0.01

Q4.23

arrow
arrow

0%

-0.00
vs 0

Q1.24

arrow
arrow

-2%

-0.02
vs -0.00

Q2.24

arrow
arrow

-2%

-0.02
vs -0.02

Q3.24

arrow
arrow

-2%

-0.02
vs -0.02

Institutionnal OwnershipShape

status-upQoQ

Q4.22

arrow
arrow

221

221
vs 180

23%

Q1.23

arrow
arrow

216

216
vs 221

-2%

Q2.23

arrow
arrow

235

235
vs 216

9%

Q3.23

arrow
arrow

225

225
vs 235

-4%

Q4.23

arrow
arrow

220

220
vs 225

-2%

Q1.24

arrow
arrow

229

229
vs 220

4%

Q2.24

arrow
arrow

227

227
vs 229

-1%

Q3.24

arrow
arrow

207

207
vs 227

-9%

Earnings Growth

Latest News

COHU

businesswire.com

16 hours ago