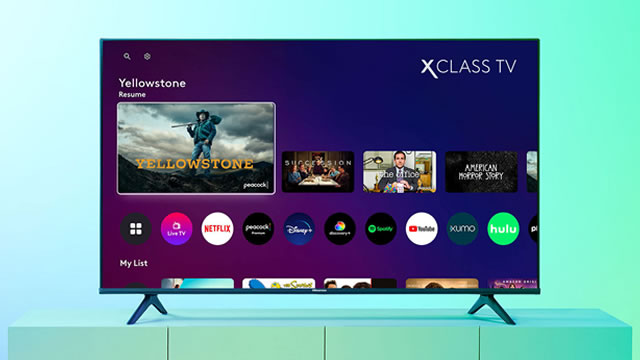
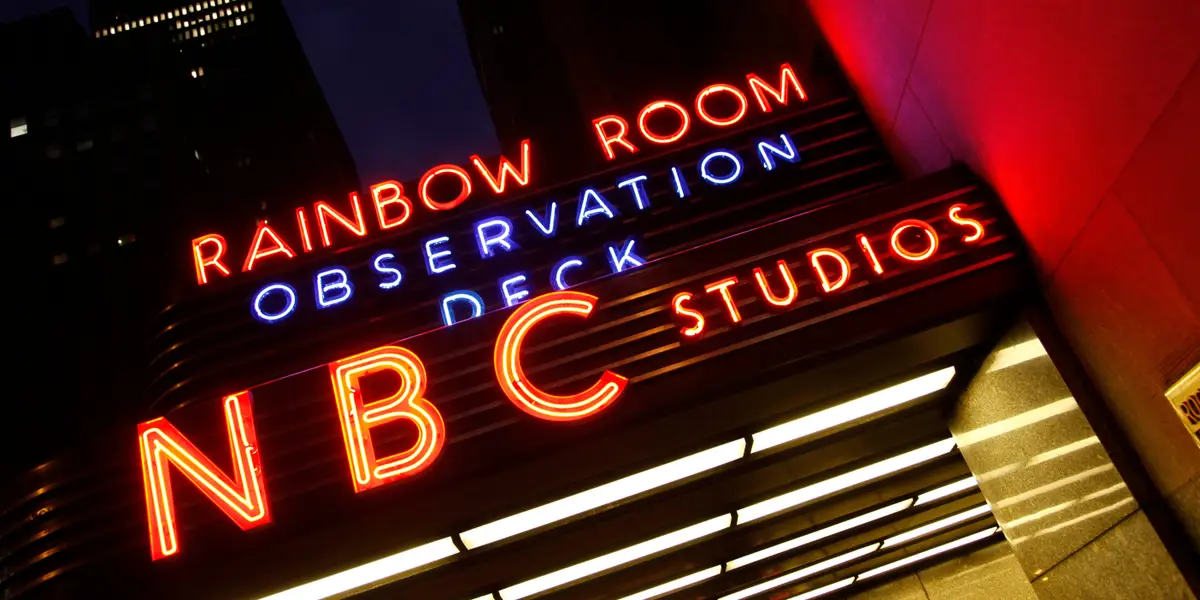
New

Chrome Plugin Live! Redefine the way you read FinTwit 🚀 Install Now

You have successfully sign out
Loading...
Shape
Comcast Corporation
CMCSA
Shape
US Flag

NASDAQ

133B

Telecommunications Services

Next Earning date - 24 Apr 2025

133B

Telecommunications Services

Next Earning date - 24 Apr 2025

35.39USD

Shape0.01 ( 0.03%)
Market Closed (as of Feb 14, 21:00 EDT)
favorite-chart

Relative Strenght

18
favorite-chart

Volume Buzz

-26%
favorite-chart

Earning Acce

No
favorite-chart

Dist 52w H.

22%

Quote Panel

Shape
Updated February 15, 2025
1W % 1M % 3M % 1Y %

Key Metrics

Shape
  • Market Cap


  • Shares Outstanding


  • Share in Float


  • Dividende


  • Earning Date

    No Data


  • Price Target


  • Average Volume


  • Beta


  • Range


  • Industry


  • Website


  • Sector


Fundamentals

Shape

Relative Strength

Shape

CMCSA

Sector

loading...

Top 5 RS in Group

Symbol

Company

RS

5-Day Perf.

Forecast

Shape

$123B

Shape284%

2025-Revenue

$4.30

Shape247%

2025-EPS

$36B

Shape461%

2025-EBITDA

Analyst rating

Strong Sell

Sell

Buy

Neutral

Strong Buy

Shape

Buy

Price Target

40.33(13.96%)

Number of analyst

3

Last analyst upgrade/downgrade

Seaport Global

upgrade

Previous: Neutral

2024-12-11

Now: Buy

Seaport Global

downgrade

Previous: Sector Perform

2024-06-24

Now: Neutral

Exane BNP Paribas

downgrade

Previous: Neutral

2024-06-11

Now: Underperform

Scotiabank

downgrade

Previous: Not converted

2023-10-27

Now: Perform

Earnings GrowthShape

status-upYoY

Current

Estimates

Q1.23

arrow
arrow

+7%

0.92
vs 0.86

Q2.23

arrow
arrow

+12%

1.13
vs 1.01

Q3.23

arrow
arrow

+13%

1.08
vs 0.96

Q4.23

arrow
arrow

+2%

0.84
vs 0.82

Q1.24

arrow
arrow

+13%

1.04
vs 0.92

Q2.24

arrow
arrow

+7%

1.21
vs 1.13

Q3.24

arrow
arrow

+4%

1.12
vs 1.08

Q4.24

arrow
arrow

+14%

0.96
vs 0.84

Q1.25

arrow
arrow

-5%

0.99
vs 1.04

Q2.25

arrow
arrow

-2%

1.19
vs 1.21

Sales GrowthShape

status-upYoY

Current

Estimates

Q1.23

arrow
arrow

-4%

29.7B  vs 31B

Q2.23

arrow
arrow

+2%

30.5B  vs 30B

Q3.23

arrow
arrow

+1%

30.1B  vs 29.8B

Q4.23

arrow
arrow

+2%

31.3B  vs 30.6B

Q1.24

arrow
arrow

+1%

30.1B  vs 29.7B

Q2.24

arrow
arrow

-3%

29.7B  vs 30.5B

Q3.24

arrow
arrow

+6%

32.1B  vs 30.1B

Q4.24

arrow
arrow

+2%

31.9B  vs 31.3B

Q1.25

arrow
arrow

-1%

29.8B  vs 30.1B

Q2.25

arrow
arrow

+0%

29.8B  vs 29.7B

Return on EquityShape

status-upQoQ

Q1.23

arrow
arrow

+5%

0.05
vs 0.04

Q2.23

arrow
arrow

+5%

0.05
vs 0.05

Q3.23

arrow
arrow

+5%

0.05
vs 0.05

Q4.23

arrow
arrow

+4%

0.04
vs 0.05

Q1.24

arrow
arrow

+5%

0.05
vs 0.04

Q2.24

arrow
arrow

+5%

0.05
vs 0.05

Q3.24

arrow
arrow

+4%

0.04
vs 0.05

Q4.24

arrow
arrow

+6%

0.06
vs 0.04

Institutionnal OwnershipShape

status-upQoQ

Q1.23

arrow
arrow

2291

2.3K
vs 2.3K

0%

Q2.23

arrow
arrow

2324

2.3K
vs 2.3K

1%

Q3.23

arrow
arrow

2403

2.4K
vs 2.3K

3%

Q4.23

arrow
arrow

2537

2.5K
vs 2.4K

6%

Q1.24

arrow
arrow

2501

2.5K
vs 2.5K

-1%

Q2.24

arrow
arrow

2404

2.4K
vs 2.5K

-4%

Q3.24

arrow
arrow

2425

2.4K
vs 2.4K

1%

Q4.24

arrow
arrow

2314

2.3K
vs 2.4K

-5%

Earnings Growth

Latest News