Company Description
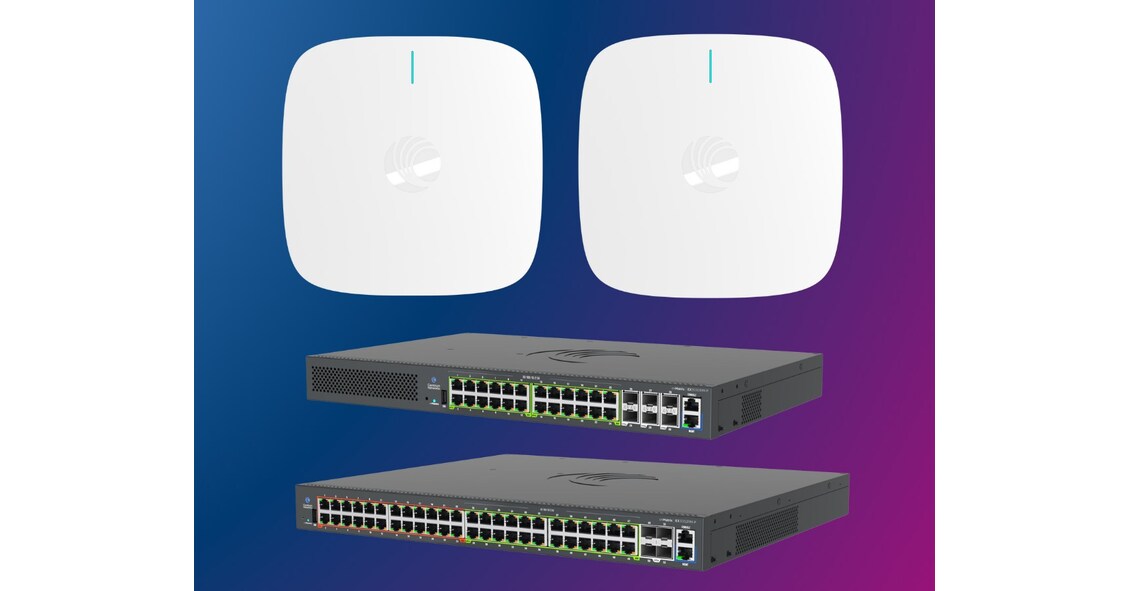
Cambium Networks Corporation, through its subsidiaries, provides wireless broadband networking infrastructure products and solutions for commercial and government network operators. Its wireless fabric includes intelligent radios, smart antennas, radio frequency (RF) algorithms, wireless-aware switches, and cloud-based network management software. The company offers point-to-point backhaul, point-to-multipoint distribution, Wi-Fi access, cnMatrix ethernet enterprise switching, cnReach IIoT, cnVision video surveillance transport, and cnMaestro and network management tools and solutions. It also offers point-to-point solutions that are connected to high-speed, high-bandwidth wireline networks; and wireless broadband backhaul to facilities or point-to-multipoint access points deployed throughout a network over distances of approximately 100 kilometers and at 2 gigabytes per second. The company also offers cnPilot and Xirrus Wi-Fi solution provides distributed access to individual users in indoor settings, such as office complexes, and outdoor settings, such as athletic stadiums and outdoor public Wi-Fi spots; cnReach solutions offer narrow-band connectivity for sensors and devices; embedded proprietary RF technology and software enables automated optimization of data flow at the outermost points in the network; cnMatrix cloud-managed wireless-aware switching solution provides the interface between wireless and wired networks; and cnVision solutions for video surveillance and CCTV deployments. It serves medium-sized wireless Internet service providers, mobile network operators, enterprises, and government agencies in North America, Europe, the Middle East, Africa, Caribbean and Latin America, and the Asia Pacific. The company was formerly known as Vector Cambium Holdings (Cayman), Ltd. and changed its name to Cambium Networks Corporation in 2018. The was founded in 2011 and is headquartered in Rolling Meadows, Illinois.
NASDAQ
Unprofitable
EPS improving
Unprofitable
EPS improving
0.84USD
Relative Strenght
90Volume Buzz
-48%Earning Acce
YesDist 52w H.
52%